Geospatial Trend of Phytodistribution Pattern of Cryptogamic Ferns in a Rainforest Vegetation
-
Edwin-Wosu Nsirim Lucky


Department of Plant Science and Biotechnology, Faculty of Science, University of Port Harcourt, Nigeria
Omara-Achong Theresa EbiaRaw Materials Research and Development Council, Abuja, Nigeria
Edward Peace OkimeDepartment of Plant Science and Biotechnology, Faculty of Science, University of Port Harcourt, Nigeria
Okeke Nnaemeka PaschalDelta Systematic Ltd, Port Harcourt, Rivers State, Nigeria
| Received 05 May, 2023 |
Accepted 16 Nov, 2023 |
Published 01 Jan, 2024 |
Background and Objective: The majority of ferns inhabit a wide range of habitats (from terrestrial, arboreal to aquatic) with either species being obligatory or facultative in their preference for ecological niche adaptation and tolerance to varying landscape physiognomy. This work was carried out at the three sub-ecological stations of International Institute of Tropical Agriculture, Onne, Rivers state, Nigeria and the objective is to assess the distribution and arrangement of fern in space using geospatial techniques in rainforest vegetation. Materials and Methods: Ground trothing ecological sampling methods, GPS for species georeferencing and ArcGIS software, (version 10.8 2021) for Nearest Neighbourhood Ratio and Autocorrelation analyses within sampling plots and among species across sampling plots of stations. Results: Nine species (Nephrolepis biserrata, Marattia fraxinea, Selaginella myosurus, Bubophyllum barbigerum, Pteris captoptera, Pteris pacifica, Nephrolepis pumicicola, Pteris burtonii and Diplazium sommatii) under six families existed in diverse niche habitation (one obligatory arboreal, six obligatory terrestrial forest floor and two facultative terrestrial/arboreal habitat). Phytospatial distribution in station I had Nephrolepis biserrata (random); Marattia fraxinea, Seleginella myosurus, Pteris pacifica and Pteris burtonii (clustered); in station II Pteris pacifica, (dispersed) and Pteris burtonii and Seleginella myosurus (clustered) and Seleginella myosurus (dispersed). Conclusion: This study has identified fern species across the various modes of habitation besides the variation while in their spatial distribution pattern. However, a clustered distribution pattern for all ferns was recorded with the spatial autocorrelation analysis.
| Copyright © 2024 Lucky et al. This is an open-access article distributed under the Creative Commons Attribution License, which permits unrestricted use, distribution, and reproduction in any medium, provided the original work is properly cited. |
INTRODUCTION
The ferns constitute an ancient division of vascular plants, some of them as old as the Carboniferous period and perhaps older1. They are group of non-flowering vascular plants (plants with xylem and phloem with pseudo-root, -stem and-complex leaves) inherently devoid of seeds but reproduce via spores. They also differ from other cryptogams (mosses and other bryophytes) due to the specialized tissues basically for water and nutrients transportation through the plant2. Ferns are widely distributed throughout the world, especially in the tropics and in Nigeria where several diversity are prevalent and abundant3,4. The region’s tropical rainforests have been recorded among the top 25 biodiversity hotspots in the world with great relevance for conservation priorities5. It has also been reported as a hub of African diversity of families, genera and species of cryptogamic pteridophytes4.
The majority of ferns inhabit a wide range of habitats (from terrestrial, arboreal to aquatic) with either of the species being obligatory or facultative with a preference for ecological niche adaptation under varying environmental conditions and physiognomic landscape6,8. This can be correlated to their biogeography in relation to environmental factors and evolutionary history9. These aspects can be addressed at different spatial and temporal scales, ranging from global to local and focusing on present-day situations as well as on past conditions10.
Modern approaches in biodiversity study and conservation require joint analysis of environmental, geographical and biological data to understand the dynamics of ecosystems and biota11,12 and this entails the use of Geo database software for the analysis of informative data13.
Such ecological distribution can be determined via the application of geographic information technology (GIT) tools in the manipulation, analysis and graphic presentation of data. It provides information and knowledge about places on the earth’s surface. It is a synergistic contribution of GIS, remote sensing (RS) and GPS to the interpretation of ecological ground data. This involves risk assessment which applies GIS as a tool used to analyze satellite images, aerial photos and field survey data. GIS is a spatial decision support system that accommodates large varieties of spatial and attribute data14. It is a collection of computer hardware, software and geographic data for capturing, managing, analyzing and displaying all forms of geographically referenced information15. It contains a powerful reference base of geographic location and maps of various biotic and abiotic indices of species, soil, land cover, topography and hydrology. Locating features associated with their attributes allows diverse data to be combined and analyzed in a single database to produce relationships / associations between environmental features and different taxa.
Remote sensing (RS) is a source of information on flora biodiversity for complete spatial coverage of environmental information for large areas in a consistent manner15. In qualitative and quantitative scales integrated geospatial applications involving, algorithms, object-oriented methods and field studies can be deployed to map biodiversity elements which are components of vegetation structure and composition as a basis image processing and visual interpretation techniques Global Positioning System (GPS) aids in spatial data collection via field surveys by direct observation. It is a system of earth-orbiting satellites that indicate the precise location (latitude and longitude coordinates) on earths’ surface.
The rationale for studying spatial patterns in plant communities is predicated on the need to understand plant communities and their characteristics in the quantitative and qualitative patterns described in spatial and temporal scales16. Though, several species of cryptogamic ferns are found thriving in various areas within the continent, including Nigeria studies have revealed the different levels of flora challenges including biodiversity loss and habitat decline among ferns due to anthropogenic and natural intrusions in different parts of the world, including Nigeria where their distribution has been documented4,8,17. Such geospatial study will also facilitate their existence and distribution, besides the paucity of information on their distribution, diversity, ecology and phenology of pteridophytes (ferns) in Africa18.
Several species of extant fern are known to vary in number because certain groups are yet poorly studied as well as new species being found in unexplored tropical areas15. The application of geospatial technology enhances the evaluation and monitoring of dynamic patterns and vulnerability of diverse ecosystem cum reveals threatened fern species which were data-based and georeferenced by the Global Biodiversity Information Facility19.
Preliminary GIS-based have been used to analyse the range size and the extent of occurrence and area of occupancy of each species20,21. The importance of using varying geospatial data from GIS for mapping applications has been reported22. Prior to the emergence of geospatial applications, variations in the species distribution patterns of vegetation were based on analog and traditional methods23.
The aim of this study was to reveal the distribution of ferns using geospatial techniques in the rainforest vegetation at the International Institute of Tropical Agriculture (IITA) Onne Rivers State; with the objectives of generating information about their localization and distribution pattern and enhancing existing information on cryptogamic ferns. Geospatial studies have immense benefits in monitoring and evaluating susceptible species and their changing patterns across diverse ecosystems and plant communities. The GIS tools and model can help in locating various vegetation resources and as well guides the activities within an area. It also helps in decision-making, ensuring that ecologists and other scientists place effective policies that control the utilization of forest resources.
MATERIALS AND METHODS
Study area, location and site: The study was conducted for three months (between June to August, 2022) in Rivers State (one of the 36 States in Nigeria), located between longitudes 6°23'E and 7°36'E and latitudes 4°18'N and 5°45'N of the equator. The east is bounded by the Imo River and Akwa-Ibom State to the west by Bayelsa State, to the north by Imo and Abia States and to the south by the Atlantic Ocean24. As at the time of the field study in parts of the area, the average climatic condition with maximum rainfall pattern was relatively humid with latitudinal and seasonal variations comparatively uniform due to the proximity of the ecozone to the Onne seaport. The area is characterized by mangrove forest, freshwater raffia palm vegetation and tropical rainforest, sandy silt or sandy loam soil. Study has revealed topographic variation with some sections underlain by impervious clay layer often leached both fresh and salt water due to heavy rainfall thus making it alkaline (salty) and sometimes acidic in nature25. The state consists of 23 Local Governments Council including Eleme the study location, georeferenced at Latitudes 4°43'0"N and 4°51'0"N and Longitude 7°3'0"E and 7°15'0"E covers about 4 km2; characterized by a tropical climate of maximum rainfall. It houses several localities, towns and suburbs, viz: Aleto, Alesa, Alode, Agbeta, Osobo, Okpaako, Akpajo, Agbonchia, Ebubu, Ogale, Gbeneue, Eteo, Ekporo, Azuabie, Sime, Eyaa, Panya, including Onne. The study site, Onne is situated at the South-South Region of Eleme study location and with the sampled site (IITA) georeferenced at latitude 4°45'0"N and Longitude 7°9'0"E.
Field sampling: An ecological field assessment of ferns using geospatial tools was carried out in a greenbelt formation of a rainforest station. A total of 3 forest stations in IITA Onne were surveyed and labeled as “stations A, B and C”. Station A forest is located in the southeast of IITA on Latitude 4°42'45"N and between Longitude 7°10'30"E and 7°10'45"E. Station B forest is located in the north of the Institute between Latitude 4°43'15"N and 4°43'30"N and Longitude 7°10'45"E. Station C is located in the middle/south east on Latitude 4°43'0"N and 4°42'60"N and Longitude 7°10'30"E and 7°10'45"E. The georeferenced coordinates and altitude for individual plant species were acquired by hand-held Global Positioning System (GPS-Garmmi Dakota 10 model). The coordinates were arranged using Microsoft Excel and then imported into ESRI’S ARC MAP software version 10.8 in which the geo-referenced map and satellite imagery showing the spatial distribution of the ferns were produced.
Data analysis: The coordinates obtained using the GPS were imputed into the ArcGIS software, version 10.8 2021 for nearest neighbourhood ratio and autocorrelation analyses, respectively to ascertain the spatial distribution pattern between individual species of ferns within sampling plot and among species across sampling plots of stations.
RESULTS
The IITA rainforest site assessment recorded under six plant families, nine species of cryptogams existing in diverse ecological niche habitation of the rainforest station as depicted in Table 1, with one obligatory arboreal, six obligatory terrestrial forest floor and two facultative terrestrial/arboreal habitat ferns. Across the three stations in their various georeferenced situates are variations in the spatial distribution of the diverse ferns (Table 2). The station I of the rainforest had eight pteridophyte species (Nephrolepis biserrata, Marattia fraxinea, Selaginella myosurus, Bubophyllum barbigerum, Pteris captoptera, Pteris pacifica, Nephrolepis pumicicola, Pteris burtonii) under five families (Davaliaceae, Marattiaceae, Selaginellaceae, Orchidaceae and Adiantaceae) of cryptogamic fern. Five species of pteridophyte (Marattia fraxinea, Selaginella myosurus, Pteris pacifica, Pteris burtonii, D. Sommatii) under four cryptogamic families (Marattiaceae, Selaginellaceae, Adiantaceae and Athyriaceae) were recorded in station II, while station III had two species (Marattia fraxinea, Selaginella myosurus) under two families (Marattiaceae and Selaginellaceae).
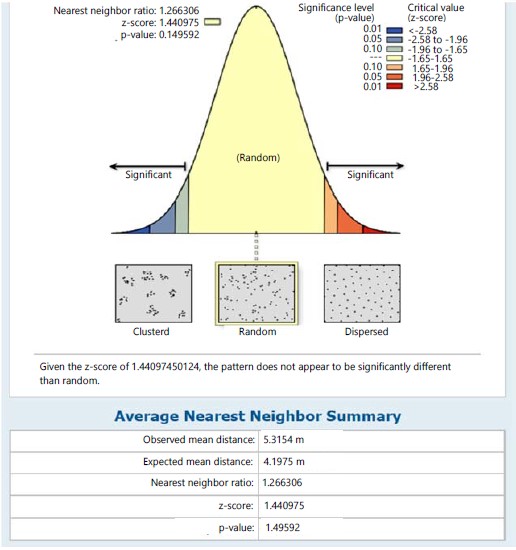
Result has also revealed the spatial distribution of the species in light of the Average Nearest Neighbourhood Analysis (ANNA) within individual species of the respective station and the autocorrelation between species in respective stations (Fig. 1-12).The phytosociological spatial distribution within species based on ANNA in station I has revealed a nearest neighbour ratio (NNR) of 1.266 for individual species of N. bisserata. Hence, the NNR is neither significantly >1 (the hypothetical random distribution factor) and given the critical value (z-score) of 1.441, the pattern of distribution does not appear to be significantly different than random (Fig. 1).
|
|
| Table 1: | Ferns recorded in the study sites | |||
| Species | Family |
Common name |
Habitat |
| Bubophyllum barbigerum Lindl. | Orchidaceae |
Cherub Orchids |
Arboreal |
| Diplazium sommatii (Kuhn) C. Chr | Athyriaceae |
Diplazium fern |
Terrestrial |
| Marattia fraxinea Sm. ex. J.F. Gmel | Marattiaceae |
King fern |
Terrestrial |
| Nephrolepis biserrata (Sw) schott | Davaliaceae |
Giant Sword fern |
Terrestrial/Arboreal |
| Nephrolepis pumicola F. Ballard | Davaliaceae |
Macho fern |
Terrestrial/Arboreal |
| Pteris pacifica | Adiantaceae |
Chinese brake fern |
Terrestrial |
| Pteris captoptera Kunze | Adiantaceae |
Pteris ferns |
Terrestrial |
| Pteris burtonii Bak | Adiantaceae |
Brake ferns |
Terrestrial |
| Selaginella myosurus (Alston) Sw. | Selginellaceae |
Spike mosses/lesser club mosses |
Terrestrial |
| Authors field work, (2022) | |||
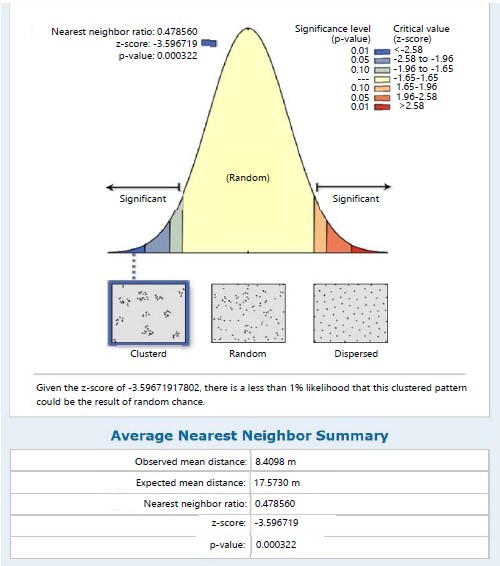
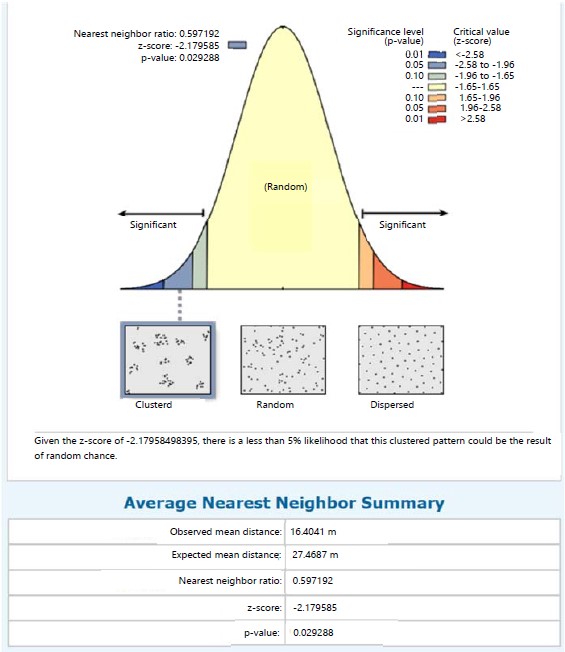
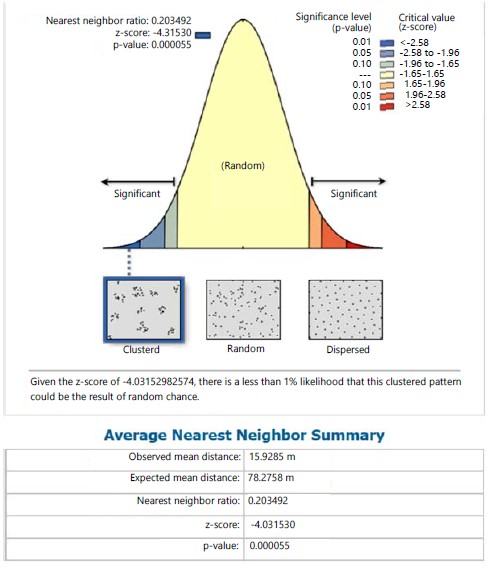
Marattia fraxinea in the same station recorded a clustered distribution pattern with its NNR of 0.479 (<1) and given the critical value (z-score) of -3.597, there was a less than 1% likelihood that the clustered pattern could be the result of random chance (Fig. 2). The nearest neighbour ratio of 0.597 (<1 the hypothetical random distribution index) for individual species of S. myosurus indicates a clustered distribution pattern and relative to the critical value (z-score) of -2.180, there was a less 5% likelihood that the clustered pattern could be the result of random chance (Fig. 3). Pteris pacifica had the nearest neighbour ratio of 0.204 (<1) indicating a clustered pattern of distribution and relative to the critical value (z-score) of -4.032, there was a less than 1% likelihood that this clustered pattern could be the result of random chance (Fig. 4), while P. burtonii had an NNR of 0.425 indicating a clustered pattern relative to a critical value (z-score) of -2.913 (Fig. 5).
| Table 2: | Global positional system coordinates of ferns in various forest station | |||
Station I |
||||
| Family | Species | Lat (N) |
Long (E) |
Alt (Ft) |
| Davaliaceae | Nephrolepsis biserrata | 04°42.762' |
007°10.664' |
13 |
04°42.764' |
007°10.664' |
11 |
||
04°42.801' |
007°10.633' |
11 |
||
04°42.808' |
007°10.624' |
11 |
||
04°42.808' |
007°10.624' |
13 |
||
04°42.816' |
007°10.619' |
11 |
||
04o42.817' |
007o10.617' |
11 |
||
04°42.820' |
007°10.616' |
15 |
||
| Marattiaceae | Marattia fraxinea | 04°42.809' |
007°10.625' |
10 |
04°42.816' |
007°10.619' |
11 |
||
04°42.817' |
007°10.617' |
11 |
||
04°42.822' |
007°10.611' |
12 |
||
04°42.824' |
007°10.612' |
9 |
||
04°42.826' |
007°10.612' |
9 |
||
04°42.710' |
007°10.622' |
21 |
||
04°42.712' |
007°10.624' |
11 |
||
04°42.713' |
007°10.625' |
10 |
||
04°42.714' |
007°10.626' |
9 |
||
04°42.715' |
007°10.628' |
13 |
||
04°42.717' |
007°10.629' |
10 |
||
04°42.719' |
007°10.632' |
12 |
||
04°42.735' |
007°10.649' |
11 |
||
04°42.742' |
007°10.656' |
14 |
||
04°42.745' |
007°10.659' |
14 |
||
04°42.747' |
007°10.661' |
9 |
||
| Selaginallaceae | Selaginella myosurus | 04°42.824' |
007°10.612' |
9 |
04°42.826' |
007°10.610' |
10 |
||
04°42.832' |
007°10.579' |
15 |
||
04°42.833' |
007°10.576' |
15 |
||
04°42.817' |
007°10.562' |
19 |
||
04°42.799' |
007°10.547' |
24 |
||
04°42.790' |
007°10.546' |
17 |
||
04°42.710' |
007°10.622' |
21 |
||
04°42.712' |
007°10.624' |
11 |
||
04°42.713' |
007°10.625' |
10 |
||
04°42.714' |
007°10.628' |
9 |
||
04°42.715' |
007°10.628' |
13 |
||
04°42.717' |
007°10.629' |
10 |
||
04°42.725' |
007°10.638' |
15 |
||
04°42.746' |
007°10.661' |
9 |
||
04°42.747' |
007°10.661' |
9 |
||
| Orchidaceae | Bubophyllum barbigerum | 04°42.762' |
007°10.664' |
13 |
04°42.764' |
007°10.664' |
11 |
||
| Adiantaceae | Pteris captoptera | 04°42.728' |
007°10.633' |
18 |
04°42.800' |
007°10.632' |
10 |
||
| Adiantaceae | Pteris pacifica | 04°42.790' |
007°10.546' |
17 |
04°42.789' |
007°10.532' |
25 |
||
04°42.787' |
007°10.531' |
18 |
||
04°42.722' |
007°10.634' |
17 |
||
04°42.725' |
007°10.638' |
15 |
||
04°42.729' |
007°10.643' |
10 |
||
04°42.747' |
007°10.661' |
9 |
||
| Davaliaceae | Nephrolepis pumicicola | 04°42.808' |
007°10.624' |
11 |
| Adiantaceae | Pteris burtonni | 04°42.826' |
007°10.610' |
9 |
04°42.833' |
007°10.576' |
15 |
||
04°42.827' |
007°10.571' |
31 |
04°42.784' |
007°10.529' |
14 |
04°42.781' |
007°10.526' |
13 |
||
04°42.710' |
007°10.622' |
21 |
||
04°42.712' |
007°10.624' |
11 |
||
04°42.713' |
007°10.625' |
10 |
||
04°42.714' |
007°10.628' |
9 |
||
04°42.715' |
007°10.628' |
13 |
||
04°42.717' |
007°10.629' |
10 |
||
04°42.719' |
007°10.632' |
12 |
||
04°42.724' |
007°10.638' |
13 |
||
04°42.729' |
007°10.643' |
10 |
||
04°42.735' |
007°10.649' |
11 |
||
04°42.739' |
007°10.653' |
15 |
||
04°42.745' |
007°10.659' |
14 |
||
Section II |
||||
| Marattiaceae | Marattia fraxinea | 04°43.277' |
007°10.523' |
9 |
04°43.395' |
007°10.487' |
9 |
||
04°43.384' |
007°10.475' |
19 |
||
| Selaginallaceae | Selaginella myosurus | 04°43.308' |
007°10.555' |
12 |
04°43.314' |
007°10.559' |
16 |
||
04°43.316' |
007°10.561' |
10 |
||
04°43.319' |
007°10.564' |
12 |
||
04°43.322' |
007°10.568' |
12 |
||
04°43.339' |
007°10.587' |
19 |
||
04°43.344' |
007°10.592' |
16 |
||
04°43.354' |
007°10.729' |
15 |
||
04°43.477' |
007°10.612' |
11 |
||
04°43.480' |
007°10.607' |
14 |
||
04°43.476' |
007°10.574' |
10 |
||
04°43.419' |
007°10.512' |
9 |
||
04°43.405' |
007°10.500' |
10 |
||
04°43.402' |
007°10.497' |
10 |
||
04°43.396' |
007°10.491' |
9 |
||
04°43.377' |
007°10.471' |
10 |
||
04°43.376' |
007°10.467' |
10 |
||
04°43.371' |
007°10.465' |
12 |
||
| Adiantaceae | Pteris pacifica | 04°43.413' |
007°10.505' |
9 |
04°43.413' |
007°10.502' |
10 |
||
04°43.481' |
007°10.473' |
23 |
||
04°43.376' |
007°10.467' |
10 |
||
| Adiantaceae | Pteris burtonii | 04°43.300' |
007°10.549' |
20 |
04°43.301' |
007°10.551' |
12 |
||
04°43.301' |
007°10.552' |
15 |
||
04°43.303' |
007°10.551' |
19 |
||
04°43.403' |
007°10.495' |
9 |
||
04°43.395' |
007°10.487' |
9 |
||
04°43.384' |
007°10.475' |
19 |
||
04°43.381' |
007°10.473' |
23 |
||
04°43.376' |
007°10.467' |
10 |
||
| Athyriaceae | D. sommatii | 04°43.426' |
007°10.660' |
11 |
04°43.432' |
007°10.656' |
9 |
||
Section III |
||||
| Marattiaceae | Marattia fraxinea | 04°42.875' |
007°10.570' |
13 |
| Selaginallaceae | Selaginella myosurus | 04°43.041' |
007°10.421' |
33 |
04°43.039' |
007°10.429' |
19 |
||
04°43.035' |
007°10.432' |
12 |
||
04°43.031' |
007°10.434' |
14 |
||
04°43.027' |
007°10.437' |
17 |
||
04°43.025' |
007°10.438' |
22 |
||
04°43.017' |
007°10.447' |
18 |
||
04°43.010' |
007°10.449' |
20 |
||
04°43.009' |
007°10.454' |
13 |
||
04°42.999' |
007°10.462' |
13 |
||
04°42.988' |
007°10.471' |
14 |
||
04°42.977' |
007°10.480' |
15 |
||
04°42.976' |
007°10.484' |
15 |
||
04°42.967' |
007°10.491' |
13 |
||
04°42.951' |
007°10.504' |
9 |
||
04°42.945' |
007°10.510' |
14 |
||
04°42.941' |
007°10.512' |
13 |
||
04°42.878' |
007°10.567' |
12 |
||
| Authors field work, (2022) | ||||
|
|

|
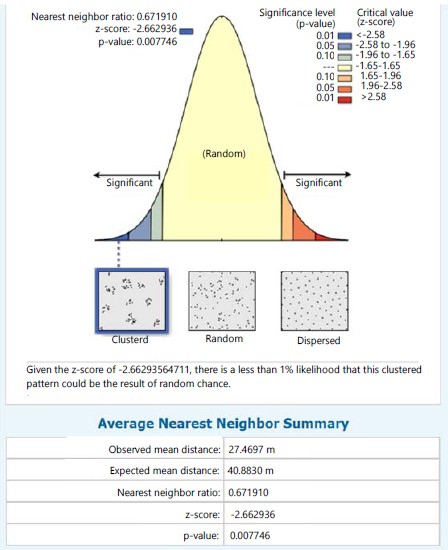
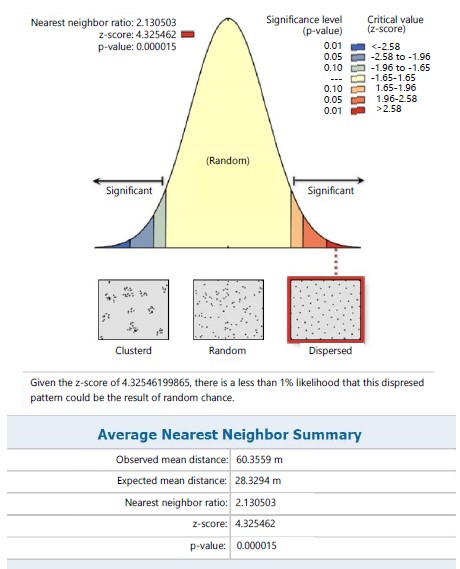
In station II, S. myosurus recorded a clustered distribution pattern with an NNR of 0.671 (<1) and given the critical value (z-score) of -2.663, there was a less than 1% likelihood that the clustered pattern could be the result of random chance (Fig. 6). While in the same station Pteris pacifica (Fig. 7). recorded a dispersed distribution pattern with an NNR of 2.131 (>1) and given a critical value (z-score) of 4.326 this implies a less than 1% likelihood that the dispersed pattern could be the result of random chance, P. burtonii with a NNR of 0.441 (<1) had a clustered pattern relative to the critical value (z-score) of -3.207, implying a less than 1% likelihood that the clustered pattern could be the result of random chance (Fig. 8).
In station III, individuals of S. myosurus showed a dispersed distribution pattern with an NNR of 2.842 (>1) and with a z-score of 14.957, there was a less than 1% likelihood that the dispersed pattern could be the result of random chance (Fig. 9).
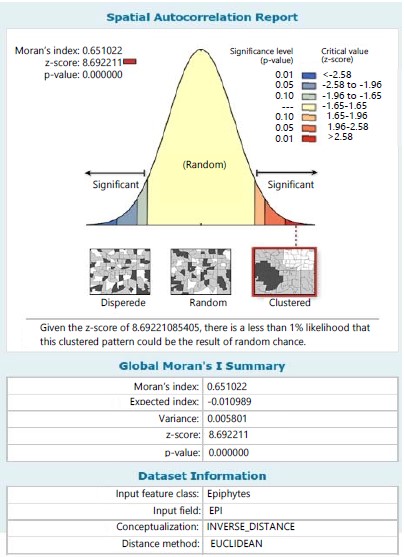
The result of spatial autocorrelation among species across stations and within stations has been exemplified in Fig. 10-12. Across stations among the species, the Moran Index value of 0.651 was recorded in which the majority of the sampling site across stations tends towards a clustered distribution pattern for all ferns (Fig. 10) and given a critical value (z-score) of 8.692, there was a less than 1% likelihood that the clustered pattern could be the result of random chance.
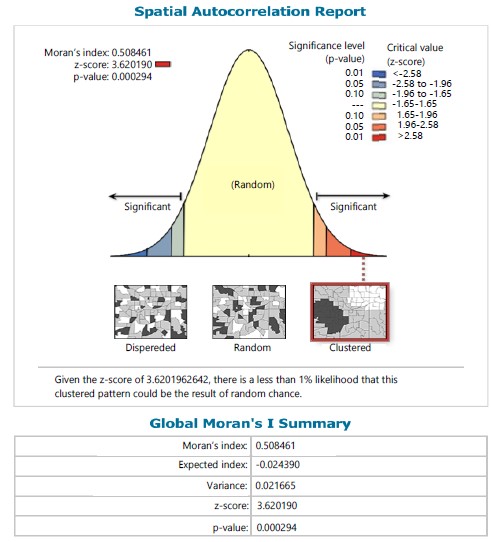
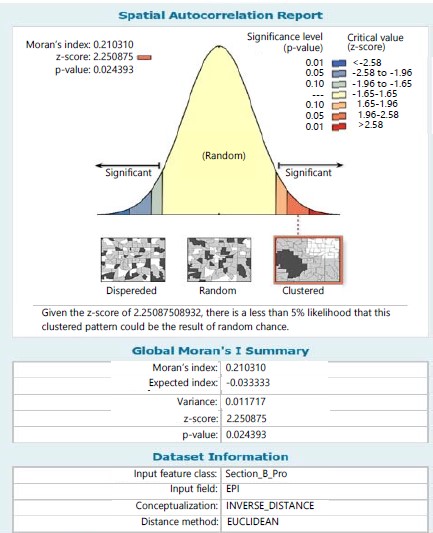
Within stations the Moran Index values of 0.508 and 0.210 were respectively recorded for species in stations I and II in which the sampling site within the stations tend towards a clustered pattern of distribution for ferns in station I (Fig. 11) and station II (Fig. 12) and given a critical value (z-score) of 3.620 and 2.251, respectively in stations I and II, there was a less than 1% likelihood that the clustered pattern could be the result of random chance.
|
|

|

|
|
|
|
DISCUSSION
The current study of phytospatial distribution of the cryptogamic fern using geospatial techniques of average nearest neighbour and spatial autocorrelation analyses has revealed the location and distribution status of all the ferns across the sampled stations. A total of nine species of cryptogamic ferns under six families were recorded with diverse ecological niche habitation with one obligatory arboreal, six obligatory terrestrial forest floors and two facultative terrestrial arboreal habitats. The terrestrial species were the most widely spread species of occurrence across the stations in the study site.
Phytosociological status by the nearest neighbour analysis (NNA) and spatial autocorrelation analysis (SAA) has indicated the trend of distribution pattern between species within station and among species across stations. The spatial distribution of occurrence with station I rich in abundance of fern species involved: Nephrolepis bisserata, Marattia fraxinea, Seleginella myosurus, Bulbophyullum barbigerum, Pteris pacifica, Pteris catoptera, Nephrolepis pumicicola, Pteris burtonii, followed by station II (Marattia fraxinea, Seleginella myosurus, Pteris pacifica, Pteris burtonii and Diplazium sommatii) and station III with the least number of species (Marattia fraxinea, Seleginella myosurus). Such trend of distribution has shown variance in abundance of respective species across stations. By such spatial trend of abundance (Table 2), station I in the order of abundance trend has M. fraxinea>P. burtonii
S. myosurus>N. bisserata >P. pacifica. station II has S. myosurus>P. burtonii>P. pacifica, while station III has only S. myosurus in abundance. It was observed from the respective sampled site that M. fraxinea, P. burtonii and S. myosurus (station I) were the most abundant species while S. myosurus was the most abundant in stations II and III, respectively.
However, the least abundance of fern species was recorded among Bubophyllum barbigerum, Pteris catoptera (station I); Diplazium sommatii (station II) and M. fraxinea (station III) in the study site and following their observed poor distribution range by the georeferenced precision, they are below the threshold potential acceptable for average nearest neighbourhood analysis.
The Bubophyllum existed as arboreal species which tend to exhibit obligatory habitation, while D. sommatii, M. fraxinea, Pteris pacifica, Pteris catoptera, Pteris burtonii and Seleginella myosurus were all terrestrial in ecological preference with obligatory habitation; hence it indicated that these species are likely persistence in such terrestrial habitat. Nephrolepis bissereta and Nephrolepis pumicicola exhibited facultative habitation hence they had the potential to exist in diverse habitat preferences.
Despite the various georeferenced situate of sampled sites for all the ferns; the autocorrelation across stations revealed a clustered distribution pattern. This implies no variation or non-significant variation in distribution pattern among species and with a critical value (Z-8.69) less than 1% could be the effect of random chance. However, between species within stations as exemplified in stations I and II, the autocorrelation indicated a distribution trend of clustering pattern and with critical value (Z- 3.62) less than 1% and (Z-2.25) less than 5% likelihood, respectively could be the effect of random chance.
The study of phytospatial distribution of these preceeding ferns is inevitable hence they are under explored and understudied in different parts of Nigeria. This corroborated with several earlier report of uneven floristic distribution which was linked to biasness in scientific research interests among botanists in their research centers and sites26-28. The application of these geospatial techniques has been used as an advantage for botanists and ecologists to indicate threatened fern species which are data-based and geo-referenced as would be exemplified in Global Biodiversity Information Facility19 and preliminary GIS-based analyses of range size20,21 which were used to measure the extent of occurrence and area of occupancy of each species.
The diverse ecological niche habitation of this present study corroborates similar spatial distribution studies among pteridophyte in tropical swamp forest vegetation, hence they were frequently distributed within the respective sampled site as been earlier opined by Edwin-Wosu et al.4. This can also be corroborated by the fact that broadly distributed species imply a broader range of conditions with consequent selectivity for ecological preferences4. This could be exemplified by their clustering distribution pattern based on the nearest neighbour ratio analysis (Fig. 2,3,5,6,8,9).
Locally, cryptogamic ferns are not randomly distributed but rather clustered or dispersed with their presence or absence relating to microhabitat characteristics and abiotic variables29,30. However anthropogenic activities such as clearing of story, logging, pruning of tree branches, or felling of whole trees often take place at the study site. All these activities as noted by Hietz et al.31 and Kromer et al.32 have an alteration impact on the natural environment and habitat and consequent changes in the diversity and distribution of ferns thus influencing their abundance as been revealed in the result. Such activities might also lead to species isolation, reduced cover, increased exposure to solar radiation and an increase in evapotranspiration rate thereby modifying the microhabitat33.
Similarly, the occurrence of ferns in different habitats is a good indicator of ecological conditions in tropical vegetation34. However, it has been revealed that some species had high plasticity; hence they occupy nearly all available habitats in various life forms35. This corroborated with Edwin-Wosu et al.4 on ecological distribution of cryptogamic flora in swampy forest where N. bisserata and N. pumicicola were also facultative with diverse habitat preference. Though these species tend to occupy numerous niches on land, swamps, on phorophytes as arboreal as well as marshes and in water bodies, their richness is driven by abiotic and anthropogenic factors36-38; thus are responsible for fern differentiation pattern hence they constitute parts of niche complexity39,40.
Hence, random distribution pattern often occurs where species are evenly or sporadically distributed across communities as earlier affirmed in Edwin-Wosu et al.4; then patchiness is a common spatial pattern in most tropical forests as could be exemplified in the present research where virtually all the species though at various stations exhibited clustering pattern in proximity to each other based on the Moran Index values.
However, a report on ferns has indicated that turnover rates is expected in the relatively homogeneous environment because the intense production of wind-dispersed spores may engender unusually high dispersal mobility41. Besides the dispersal abilities, they can be restricted by habitat availability42, adverse environmental conditions, scarcity of resources and eminent competition43. But they often survive such harsh conditions by exhibiting ecophysiological, morphological and anatomical adaptation as can be exemplified by Bromeliads with stiff upturned leaves for large water storage and Platycerium spp. with thick and waxy leaves to retain moisture32. Therefore based on the foregoing observations besides the variation in biotic and abiotic cum habitat and microclimatic conditions this study has identified fern species across the facultative and obligatory modes of habitation.
Hence, ferns play a significant role as indicators of their ecological niche this study is of great implication to various endevours of environmental studies. Spatial patterns of plant species underline the implication of dynamics in space and time for a thorough understanding of biotic interactions within the ecosystem. The data from the geospatial assessment of the ecological distribution of these ferns can aid in new discoveries, while identifying the different fern species found in the various forest stations in the study area.
By implication the spatial distribution of ferns within these region can make fern knowledge easier within their ecosystem. The result of this study can help greatly in the analysis of fern distribution and species richness as well as in conservation priorities and management of these species. With visual data collected, it can help in the development of maps revealing the various information about the study site.
Geospatial studies have immense benefits to the environment, monitoring and evaluating susceptible species and assessing the changing patterns observed across diverse ecosystems and plant communities.
Such geospatial study will also facilitate the understanding of existence, distribution, diversity, ecology and phenology of pteridophytes (ferns) beside the paucity of information on their distribution, in Nigeria.
The applications of the study include that GIS is a technology that incorporates tools and model that guides activities within an area it can applied in locating various vegetation resources. The study can be deployed for assessment, monitoring and modeling the distribution of ferns in their diverse spatial and temporal scales, thereby measuring the extent of occurrence and occupancy of each species. It can also be applied in evaluation and monitoring of dynamic patterns and vulnerability of diverse ecosystem and as such could reveal threatened fern species. It helps in decision-making, ensuring that ecologist and other scientist place effective policies that control the utilization of forest resources.
The limitations of the study include rapid loss of natural reserves for cryptogamic study due to high impact of anthropogenic drivers such as pollution incident, forestry poaching and logging, agronomic encroachment and infrastructural emergence. Lack of interest coupled with high apathy among botanists and ecologists to under take research on this group of under studied Cryptogamic plants.
Continous adoption of conventional methods of vegetation analysis due to high cost implication involve in the deployment of geographic information technology (GIT). Little or lack of collaboration among Geographers, GIS expert and vegetation experts (Botanists and Ecologists) for a sustained qualitative and quantitative floristics assessment of vegetation system.
The future recommendations include effective funding is needed for the exploration and study of this group of cryptogams. Maximum collaboration is needed among vegetation resource experts. There is a need for research free access to vegetation resource materials and natural reserve areas devoid of access restrictions and beurucratic bottle necks.
CONCLUSION
This study has shown that the technique of using GIS in accessing the vegetation distribution holds significant potential hence it has revealed the current spatial distribution of fern species cum their variation, abundance and occurrence and phytosociological analysis based on the index of average nearest neighborhood and Moran index of autocorrelation with and among the stations in the study location. Despite the variation among species, the distribution trend across stations tends more toward a clustering pattern than dispersion though with the species in various stations (B. barbigerum, P. catoptera, N. biserrata, P. pacifica, M. fraxinea and D. sommatii) been limited in abundance and occurrence among the species. Such analysis can further be an avenue for conservation priorities as well as decision making by ensuring that ecologists, pteridologists, environmental biologists and other scientists place effective police in qualitative and quantitative measurement of species.
SIGNIFICANCE STATEMENT
The purpose of this study was predicated on the fact that this group of lower plant are under studied in Nigeria besides unexplored species in this parts of tropical area. Thus it becomes necessary for this study on cryptogamic ecology of endemic fern species in this parts of Nigeria. Result revealed nine species under six families. Phytospatial analysis has revealed diverse distribution as random; clustered and dispersed pattern among the species. The spatial autocorrelation recorded clustered distribution pattern for all ferns. The study is of significant contribution in terms of the data revealing the localization and enhance information on cryptogamic ferns, aiding new discoveries, development of maps and imageries of the various information about target area and hot spot for conservation priorities.
ACKNOWLEDGMENTS
This paper is an excerpt of the result of an approved research project at the University of Port Harcourt, Nigeria. The authors thank colleagues, the Curator and Cartographer that contributed to the fieldwork in the course of the study.
REFERENCES
- Nitta, J.H., E. Schuettpelz, S. Ramírez-Barahona and W. Iwasaki, 2022. An open and continuously updated fern tree of life. Front. Plant Sci., 13.
- Large, A.R.G. and G.E. Petts, 1994. Rehabilitation of River Margins. In: The Rivers Handbook: Hydrological and Ecological Principles, Calow, P. and G.E. Petts (Eds.), Blackwell Science Ltd., Hoboken, New Jersey, ISBN: 9780632029853, pp: 401-418.
- Salazar, L., J. Homeier, M. Kessler, S. Abrahamczyk, M. Lehnert, T. Krömer and J. Kluge, 2015. Diversity patterns of ferns along elevational gradients in Andean tropical forests. Plant Ecol. Divers., 8: 13-24.
- Edwin-Wosu, N.L., C.C. Anekwe and N.P. Okeke, 2022. Geospatial ecological distribution of cryptogamic flora in swamp forest riparian vegetation in parts of Rivers State, Nigeria. Ethiop. J. Environ. Stud. Manage., 15: 111-124.
- Myers, N., R.A. Mittermeier, C.G. Mittermeier, G.A.B. da Fonseca and J. Kent, 2000. Biodiversity hotspots for conservation priorities. Nature, 403: 853-858.
- Swaine, M.D. and J.B. Hall, 1976. An application of ordination to the identification of forest types. Plant Ecol., 32: 83-86.
- Warkentin, I.G. and J.M. Reed, 1999. Effects of habitat type and degradation on avian species richness in Great Basin riparian habitats. Great Basin Nat., 59: 205-212.
- Watkins Jr., J.E. and C. Cardelús, 2009. Habitat differentiation of ferns in a lowland tropical rain forest. Am. Fern J., 99: 162-175.
- Lomolino, M.V., 2001. Elevation gradients of species-density: Historical and prospective views. Global Ecol. Biogeogr., 10: 3-13.
- Kessler, M., 2010. Biogeography of Ferns. In: Fern Ecology, Mehltreter, K., L.R. Walker and J.M. Sharpe (Eds.), Cambridge University Press, Cambridge, England, ISBN: 9780511844898 pp: 22-60.
- Soulé, M.E. and G. Orians, 2001. Conservation Biology: Research Priorities For The Next Decade. Island Press, Washington, D.C., ISBN: 9781597263184 Pages: 328.
- Foody, G.M., 2008. GIS: Biodiversity applications. Prog. Phys. Geogr., 32: 223-235.
- Salino, A., G. Rouhan, L.Y. Kuo and T.E. Almeida, 2023. Editorial: Biology, systematics, and evolution of ferns and lycophytes in the omics era. Front. Plant Sci., 14.
- Salem, B.B., 2003. Application of GIS to biodiversity monitoring. J. Arid Environ., 54: 91-114.
- Gillespie, T.W., G.M. Foody, D. Rocchini, A.P. Giorgi and S. Saatchi, 2008. Measuring and modelling biodiversity from space. Prog. Phys. Geogr.: Earth Environ., 32: 203-221.
- Dale, M.R.T., 2009. Concepts of Spatial Pattern. In: Spatial Pattern Analysis in Plant Ecology, Dale, M.R.T. (Ed.), Cambridge University Press, Cambridge, England, ISBN: 9780511612589, pp: 1-30.
- Adeonipekun, P.A., M.B. Adebayo and O.O. Oyebanji, 2021. Spore characterisation and its taxonomic significance in ferns from Lagos State, Nigeria. Grana, 60: 271-286.
- Aldasoro, J.J., F. Cabezas and C. Aedo, 2004. Diversity and distribution of ferns in sub-Saharan Africa, Madagascar and some islands of the South Atlantic. J. Biogeogr., 31: 1579-1604.
- Qian, H., J. Zhang and M.C. Jiang, 2022. Global patterns of fern species diversity: An evaluation of fern data in GBIF. Plant Divers., 44: 135-140.
- Williams, P.H., C.J. Humphries and R.I. Vane-Wright, 1991. Measuring biodiversity: Taxonomic relatedness for conservation priorities. Aust. Syst. Bot., 4: 665-679.
- Rivers, M.C., L. Taylor, N.A. Brummitt, T.R. Meagher and D.L. Roberts et al., 2011. How many herbarium specimens are needed to detect threatened species?. Biol. Conserv., 144: 2541-2547.
- Wulder, M.A. and S.E. Franklin, 2006. Integrating GIS and Remotely Sensed Data for Mapping Forest Disturbance and Change. In: Understanding Forest Disturbance and Spatial Pattern: Remote Sensing and GIS Approaches, Wulder, M.A. and S.E. Franklin (Eds.), CRC Press, Boca Raton, Florida, ISBN: 9780429114434, Pages: 1-29.
- Edwin-Wosu, N.L., T. Mojuetan, B.C. Ndukwu and C.A. Micheal, 2019. Geospatial technology, a satellite -based change detection agent: Imperative for analysis and management of vegetation resources in developing economy. Niger. J. Bot., 32.
- Edwin-Wosu, N.L. and E.A.B. Edu, 2013. Eco-taxonomic assessment of plant species regeneration status in a post-remediated crude oil impacted site in parts of Ibibio-I-Oil field in Ikot-Ada Udo, Ikot-Abasi local government area of Akwa Ibom State, Nigeria. Asian J. Plant Sci. Res., 3: 14-23.
- Edwin-Wosu, N.L. and M.C. Ahanonu, 2020. Geospatial delineation of arboreal epiphytes in a greenbelt canopy formation in parts of Rivers State, Nigeria. Asian J. Sci. Technol., 11: 11090-11103.
- Palmer, M.W., D.J. McGlinn and J.D. Fridley, 2008. Artifacts and artifictions in biodiversity research. Folia Geobot., 43: 245-257.
- Garbari, F. and G. Bedini, 2006. The flora of the Apuan Alps (Tuscany, Italy): Survey of biosystematic investigations. Willdenowia, 36: 149-155.
- Sastre, P. and J.M. Lobo, 2009. Taxonomist survey biases and the unveiling of biodiversity patterns. Biol. Conserv., 142: 462-467.
- Nóbrega, G.A., P.V. Eisenlohr, M.L.B. Paciência, J. Prado and M.P.M. Aidar, 2011. Ferns composition and diversity differ between Restinga and Lowland Rainforest areas in the Serra do Mar?. Biota Neotrop., 11: 153-164.
- Patil, S., R. Lavate, V. Rawat and M. Dongare, 2016. Diversity and distribution of pteridophytes from Satara District, Maharashtra (India). Plant Sci. Today, 3: 149-156.
- Hietz, P., G. Buchberger and M. Winkler, 2006. Effect of forest disturbance on abundance and distribution of epiphytic bromeliads and orchids. Ecotropica, 12: 103-112.
- Kromer, T., M. Kessler, S.R. Gradstein and A. Acebey, 2005. Diversity patterns of vascular epiphytes along an elevational gradient in the Andes. J. Biogeogr., 32: 1799-1809.
- Adubasim, C.V., H.A. Akinnibosun, S.N. Dzekewong and S.E. Obalum, 2018. Diversity and spatial distribution of epiphytic flora associated with four tree species of partially disturbed ecosystem in tropical rainforest zone. Agro-Science, 17: 46-53.
- Bergeron, A. and S. Pellerin, 2014. Pteridophytes as indicators of urban forest integrity. Ecol. Indic., 38: 40-49.
- Jones, N.A., H. Ross, T. Lynam, P. Perez and A. Leitch, 2011. Mental models: An interdisciplinary synthesis of theory and methods. Ecol. Soc., 16.
- Aros-Mualin, D., S. Noben, D.N. Karger, C.I. Carvajal-Hernández and L. Salazar et al., 2020. Functional diversity in ferns is driven by species richness rather than by environmental constraints. Front. Plant Sci., 11.
- Lorscheitter, M.L., 2003. Contribution to the Holocene history of Atlantic Rain forest in the Rio Grande do Sul State, Southern Brazil. Rev. Mus. Argent. Cienc. Nat., 5: 261-271.
- Mehltreter, K., 1996. Species richness and geographical distribution of montane pteridophytes of Costa Rica, Central America. J. Bot. Taxon. Geobotany, 106: 563-584.
- Krömer, T., A. Acebey, J. Kluge and M. Kessler, 2013. Effects of altitude and climate in determining elevational plant species richness patterns: A case study from Los Tuxtlas, Mexico. Flora-Morphol. Distrib. Funct. Ecol. Plants, 208: 197-210.
- Iler, A.M. and D.W. Inouye, 2013. Effects of climate change on mast-flowering cues in a clonal montane herb, Veratrum tenuipetalum (Melanthiaceae). Am. J. Bot., 100: 519-525.
- Page, C.N., 2002. Ecological strategies in fern evolution: A neopteridological overview. Rev. Palaeobot. Palynol., 119: 1-33.
- Richard, A.F., R.E. Dewar, R.E. Schwartz and J. Ratsirarson, 2000. Mass change, environmental variability and female fertility in wild Propithecus verreauxi. J. Hum. Evol., 39: 381-391.
- Lorenzo, N., D.G. Mantuano and A. Mantovani, 2010. Comparative leaf ecophysiology and anatomy of seedlings, young and adult individuals of the epiphytic aroid Anthurium scandens (Aubl.) Engl. Environ. Exp. Bot., 68: 314-322.
How to Cite this paper?
APA-7 Style
Lucky,
E.N., Ebia,
O.T., Okime,
E.P., Paschal,
O.N. (2024). Geospatial Trend of Phytodistribution Pattern of Cryptogamic Ferns in a Rainforest Vegetation. Trends in Applied Sciences Research, 19(1), 1-19. https://doi.org/10.3923/tasr.2024.1.19
ACS Style
Lucky,
E.N.; Ebia,
O.T.; Okime,
E.P.; Paschal,
O.N. Geospatial Trend of Phytodistribution Pattern of Cryptogamic Ferns in a Rainforest Vegetation. Trends Appl. Sci. Res 2024, 19, 1-19. https://doi.org/10.3923/tasr.2024.1.19
AMA Style
Lucky
EN, Ebia
OT, Okime
EP, Paschal
ON. Geospatial Trend of Phytodistribution Pattern of Cryptogamic Ferns in a Rainforest Vegetation. Trends in Applied Sciences Research. 2024; 19(1): 1-19. https://doi.org/10.3923/tasr.2024.1.19
Chicago/Turabian Style
Lucky, Edwin-Wosu, Nsirim, Omara-Achong Theresa Ebia, Edward Peace Okime, and Okeke Nnaemeka Paschal.
2024. "Geospatial Trend of Phytodistribution Pattern of Cryptogamic Ferns in a Rainforest Vegetation" Trends in Applied Sciences Research 19, no. 1: 1-19. https://doi.org/10.3923/tasr.2024.1.19

This work is licensed under a Creative Commons Attribution 4.0 International License.