Enabling Polluter-Pays Principle: Integrating Valuation for Groundwater Pollution in Chunnakam-Jaffna
-
Pasdunkorale Arachchige Jayamini Champika

Hector Kobbekaduwa Agrarian Research and Training Institute, Colombo 00700, Sri Lanka
| Received 10 Oct, 2023 |
Accepted 01 Jan, 2024 |
Published 02 Jan, 2024 |
Background and Objective: One of the main bottlenecks in estimating polluter-pays values is revealing the total private cost of environmental deterioration for every affected individual. Consequently, this study aims to present a precise methodological approach for evaluating the comprehensive cost of water pollution in Chunnakam-Jaffna. Materials and Methods: To assess the pollution’s impact on the WTA value, a representative sample was selected, encompassing around 10% of the population within each 0.25 km radius of the pollution source. Assuming uniform pollution levels within each 0.25 km area, a list of 200 permanent residents obtained from the divisional secretariat was used. Prior to the questionnaire survey, conducting focus group discussions within the communities is essential to estimate the precise bid value. Results: Eleven variables were identified as independent factors that could influence the determination of the WTA value. Among these, six variables were expected to exhibit a positive relationship with WTA, including the level of education, income, monthly medical expenditure, cost of aversion activities, loss of earnings and family size. Conclusion: The calculation of WTA is one of the most effective techniques for comprehensively assessing the true cost of environmental pollution. Therefore, victims could be compensated using WTA values rather than relying on an underestimated blanket value for the entire area.
| Copyright © 2024 Pasdunkorale Arachchige Jayamini Champika. This is an open-access article distributed under the Creative Commons Attribution License, which permits unrestricted use, distribution, and reproduction in any medium, provided the original work is properly cited. |
INTRODUCTION
The international community’s initial recognition of the importance of pollution control was observed in 1972 when the Stockholm Declaration was adopted1. Subsequently, the United Nations Conference on Environment and Development (UNCED) emphasized that individuals or entities responsible for environmental pollution should bear the cost of the harm they cause2. However, some developing countries have deviated from the polluter pays principle and embraced a government pays principle. This shift reflects the prioritization of victim welfare over penalizing the polluters. While developed nations quickly adapted their domestic laws, regulations and bylaws to align with international standards, developing nations have faced challenges in updating their legal structures to comply with international environmental laws3,4. Property rights play a crucial role in determining who is responsible for compensating whom. Typically, citizens are granted the right to access clean water and air as per the Rio Conference agreement. This implies that entities emitting pollutants are obligated to compensate those affected5. However, practical negotiations between polluters and their victims often fail to yield efficient outcomes due to two main reasons: The presence of multiple victims, which gives rise to free-rider problems6.
Determining the actual damage caused by pollutants remains challenging due to the complex and multifaceted impacts on both the biotic and abiotic aspects of the affected environment. Consequently, both direct methods for assessing damage and non-market valuation techniques, such as the willingness to accept (WTA) method, are employed to obtain the most accurate value7. In the case of health risks resulting from environmental pollution caused by the limestone industry in Sri Lanka, the WTA compensation was estimated at Rs. 792 per person/month in 2009. Furthermore, Athukorala8 identified several significant determinants affecting the WTA value, including medical expenditures, income losses, proximity to pollution sources and personal income.
The first application of the “polluter pays” principle in Sri Lanka occurred twenty-seven years after the Rio Conference agreement. In the case of groundwater pollution in Chunnakm, the Northern Power Company (Pvt) Ltd., was ordered to pay 20 million LKR (equivalent to 114,870 USD as at 2019) to the affected residents of Chunnakam Village, Jaffna District, for contaminating groundwater with waste discharges from its thermal power station. This court order was based on the “polluter-pays” principle of environmental law9. It ordered that head of households living within a 1.5 km radius of the power station, whose wells had been contaminated with oil, grease and/or BTEX (benzene, toluene, ethylbenzene and xylene), were entitled to receive compensation, up to a maximum of LKR 40,000 as a lump sum, for well rehabilitation9.
However, it was evident that a comprehensive non-market valuation technique, such as determining WTA, to ascertain the monetary value of the negative externality was not employed. Instead, the average cost of well rehabilitation was used as the basis for calculating compensation. According to the utility maximization theory in economics, individuals make choices that maximize their utility within a given budget constraint10. This implies that the level of perceived damage due to environmental degradation and the required compensation to restore one's utility to its previous level can vary significantly based on individual circumstances. Using a uniform compensation value for all individuals fails to capture the true cost of pollution for each and every individual. Therefore, the objective of this study was to propose a methodologically sound approach for accurately assessing the total cost of water pollution in Chunnakam, Jaffna.
MATERIALS AND METHODS
Study area: This study was carried out from March, 2020 to June, 2020. The area of the study is Chunnakam (town area as well as the village) in Valikamam South Divisional Secretariat (DS) in Jaffna District, located at 9.7376°N, 80.0245°E, in the Northern Province of Sri Lanka. It is situated 313 km North of Colombo, the country’s capital city. The total land area of the DS was 30 km2 of which, about 60% of land is devoted to agriculture-mainly paddy followed by other seasonal crops such as red onion, vegetables and potato. The area is classified as a low country-dry zone according to the agro-climatic classification. Annual rainfall is less than 1750 mm with a distinct dry season from May to September and the land area is below 300 m elevation from sea level11. The main source of water in the town area of the Chunnakam is the pipe bone water. Chunnakkam village mainly depends on underground open-dug wells as the main water source for drinking, agriculture and industry. Approximately 28,000 such wells with an average depth varies from 20 to 25 feet are distributed throughout the Jaffna District.
Sampling technique and data collection: A sample survey could be carried out in the collection of primary data. Random sampling technique is suited in selecting the sample for the questionnaire survey. Based on the water quality assessments carried out by the authorities, it was revealed that groundwater was polluted and the quality has gone down below the recommended level within the area of 1.5 km radius from the source of pollution. Based on prior information and technical support, area in which the level of pollution stay approximately at the same level can be calculated. (this was assumed as an area within a 0.25 km radius). To measure the variation of pollution and its’ effect on the variation on the WTA value, a sample can be drawn representing approximately 10% of the population living in each 0.25 km area from the source of pollution with the assumption of no significant variation of the level of pollution within an area 0.25 radius. A list of permanent residents of the area can be obtained from the divisional secretariat. Using the list, a sample of 200 can be randomly drawn. Before conducting the actual questionnaire survey, focus group discussions need to be conducted with the communities to get an idea about the accurate bid value to be presented. Based on this information, suggested bid values can be derived as accurate as possible.
As per the model developed by Harrington and Portney12 an individual’s well-being increases with aggregate consumption (C) and leisure (L) but it is negatively affected by the deterioration of health which is measured by the number of sick days (S):
Where, the utility (U) is growing with increasing C and L whereas it is decreasing with S. The Z is a vector of individual characteristics encompassing income, leisure and health13.
Athukorala8 has developed the following relationship between pollution (P) and health outcomes (S) as a ‘dose-response function’. It hypothesized that an individual’s health status at a given time is a function of pollution level (P) and averting expenditure (A):
It is assumed that the number of sick days is inversely related to averting expenditure (A) while it is positively related to level of pollution (P) at a given point in time. Next, it is expected that an individual allocates his/her total time (T) between work (W) and leisure (L) and spends total income on aggregate consumption, medical expenditure and averting activities. It is predicted that an individual selects the level of C, L and A to maximize utility subject to the following budget constraint:
According to the above equation, the price of medical expenditure and averting activities are denoted as Pm and Pa. The hypothesized averting activities are represented by (A) while w denotes wage rate.
Next, the price of one unit of aggregate consumption good is normalized to one. Budget constraint accepts the condition that the sum of income earned by working and value of the leisure is equal to the total possible expenditure. In other words, time allocation to work as well as medical care expenditure is expressed as a function of the number of sick days. The above equation can be re-written as follows:
Harrington and Portney12 and Alberini and Krupnick13 has explained that fowling the utility maximization theory, willingness to pay for a marginal change in pollution is developed as explained by the equation below:
The equation indicates that the Willingness to Accept (WTA) can be calculated by multiplying the dose-response function (ds/dp) by the marginal value of illness. Marginal value of illness is broken down into four primary components such as: Marginal lost income values (dw/ds), the marginal cost of medical expenses (dm/ds) and the marginal cost of averting activities (da/ds). Furthermore, WTA accounts for the disutility of illness (Us/λ), which is converted into a monetary value by dividing it by the marginal utility of income. Given the above explanation, individual WTA can be expressed as a function of lost earnings, medical expenses, averting activity costs and socio-demographic characteristics. This can be analyzed using ordinary least squares (OLS) regression as an initial step.
This method applies dichotomous-choice method to collect the data. In this approach, 200 respondents can be asked whether they are willing to accept a presented value (bid value per month) as compensation for the polluted domestic water source. If one says yes, their WTA is regarded as equal to the presented bid value (base value). The process is called an “iterated series of question” for obtaining an indicator WTA value of each individual12. The likelihood of respondents accepting or rejecting is calculated for each offered monetary amount. Next, a statistical model is employed to create a probability curve for acceptance, for each distinct group identified within the sample. Here, we use a binary variable, where “Yes” is represented as 1 and “No” as 0, as the dependent variable. The bid amount and various socio-demographic factors are considered independent variables. After transforming the dependent variable into an odds ratio (the natural logarithm of the odds of the event occurring or not occurring), maximum likelihood estimation can be applied10,14. To calculate the mean willingness to accept (MWTA), the intercept can be divided by the coefficient of the proposed WTA level in the estimated Logit regression model:
 |
Where:
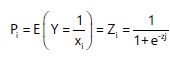
As per the equation above, the ith household, denoted as Y, is a binary variable indicating “yes” or “no.” Pi represents the probability of Y being equal to 1 and Xi is a collection of explanatory variables, “ i” stands for the error term and β denotes a parameter vector shared among all households:
Where, Xi is the vector of explanatory variables relevant to each respondent. β is the vector of unknown parameters, Pi is the probability and is the error term which is assumed normally distributed14. If the respondent says ‘yes’ to a suggested WTA value, it is assumed that the WTA value is a function of all the socio-demographic, distance-related and availability of multiple water sources related characteristics. The ordinary least square method could be applied to estimate the variability of the dependent variable of the WTA value.
RESULTS AND DISCUSSION
Sign of the variables used in OLS regression
Age of the head of the household: A negative correlation between age and WTA value is expected as younger individuals are by far the most responsive to changes happening in the surrounding environment compared to older individuals. They are comparatively more aware (due to more access to the internet) of the impending health risks and their level of mobility is higher than the older people. Further, young people tend to keep the options open and compare the trade-off between remaining in a place where environmentally hazardous vs. leaving the place of the older generation. On the other hand, there is a high tendency for younger households to have younger children, which might further increase the level of concern relating to health-related risk.
Gender of the household: It assumed that being a female head of household was negatively related to WTA amount. Traditionally, the male spouse is considered as the head of the household in the considered community. Generally, a female becomes the head of the household when she becomes a single parent due to divorce or as a result of the death of the male spouse. Considering the geographical location of the area, it can be identified as one of the areas in the northern peninsular where civil war was experienced during 1983-2009. Though the national statistics show that the number of females-headed households in war-affected areas is as the same as the national average, the author’s experience in engaging in these communities revealed that there are pockets of war-affected areas where the percentage of female-headed households are alarmingly high as 40%. Based on the above findings, it is expected that 35-40% of female-headed households in the sample. It is expected that they are less mobile, compared to male headed households due to cultural barriers as well as high dependency on the support network. On the other hand, most of the female-headed households are receiving different grants and subsidies from the government as well as non-governmental organizations as victims of civil war. Because of all these reasons, they are assumed to be less likely to leave the place even if it becomes environmentally hazardous.
Level of education: It is expected a positive correlation between the level of education and WTA value as higher the education level, increases the access to knowledge and other sources of information. They have the ability to calculate the impending health risk and the cost associated with it far better than a less educated individual.
Income: The positive relationship between levels of income and WTA is predicted. When the level of income of the head of the household increases, their access to knowledge increases and thereby It is expected that level WTA is inversely related to the distance to the source of pollution.
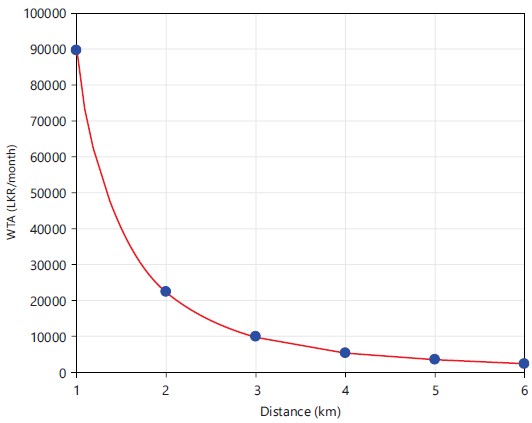
Distance: As the distance increases, it is assumed that the negative effect of water pollution is decreasing (Fig. 1) at an increasing rate due to the dilution effect and the physical barriers to mix mixing water belonging to two different aquifers.
Medical expenditure (Rs/month): The WTA is expected to increase as per month medical expenditure due to water pollution increases. Therefore, a positive correlation between the two variables is predicted.
Cost of aversion activities: A positive correlation between the cost of aversion activities (such as buying water for drinking purposes and rehabilitation of wells at high frequency) and WTA is expected as more money will be spent on aversion activities.
Loss of earning: It is assumed that WTA is positively related to loss of earnings caused by health hazards because of environmental pollution.
|
Access to alternative water sources for drinking purpose: It is predicted that access to alternative water sources for drinking purposes (mainly pipe born safe-to-drink water) is negatively affected by the amount of WTA.
Family size: A positive relationship between WTA and family size is predicted as the cost of averting activities increases as family size increases.
Age of the children: A negative relationship between WTA and the age of the children is predicted as the younger children, the vulnerability to waterborne diseases is high and thereby the cost of averting activities and medical expenditure is expected to increase.
After conducting the regression, the variables that had a significant effect on WTA could be selected and log value can be calculated. The hypothesized bid values are ranging from the lowest price (Rs. 1000) to the highest price (Rs. 10,000), in an equal increment of Rs. 1000. The dependent variable measures the percentage of respondents who answered ‘yes’ to the offered bid value. When the bid value increases, the probability of saying yes is expected to increase.
Interpretation of the logistic regression results is as follows. Bid value is the dependent variable and the explanatory variables are the selected significant variables of the OLS regression. Each slope coefficient is a partial slope coefficient which measures the changes in the estimated log likelihood for a unit change in the value of the given parameter, holding the other parameters constant. Coefficients which are significant at 5% have a significant impact on bid value. Based on the results obtained, both mean and median WTA per household per month can be calculated by intercept/slope equation.
Median willingness to accept value is more appropriate than mean WTA as it is less sensitive to outliers. Mean WTA is the average amount of money the household would be willing to accept each month to bear the risk of environmental hazards. Median WTA is the probability of monetary value of the level at which 50% percent of the population is willing to bear the risk of environmental hazards.
Gamage et al.11, indicated that one of the main problems in estimating WTA is the effect of various biases such as anchoring bias, interviewer bias and information bias. To reduce the impact of anchoring bias, focus group discussions need to be conducted with the communities to get an idea about their WTA value and variables that might have an impact on the WTA (as discussed in the materials and methods section). Based on this information, suggested bid values can be derived as accurately as possible. As this is a health-related issue, information bias can play a significant role. The average person in the community might not be aware of the potential health risks of consuming polluted water. This will give rise to either over-estimation or under-estimation of WTA. Therefore, prior to the actual interview, frequent consultation with medical personnel and sector specialists is necessary. Both the interviewers as well as the community need to be aware of the actual health risks and the cost associated with polluted water, before conducting/participating for the actual interview. (At present, there is a growing concern of the ‘kidney disease of un know etiology’ which is a fatal disease, prevalent among farming communities in Sri Lanka, caused by long term exposed to heavy metal contaminated water. Thus, there is a high possibility of confusing two scenarios if the respondents were not properly made aware of). Another concern is that, the people of this area had received various grants and subsidies from both governmental and non-governmental sources mainly in the form of livelihood support grants. Therefore, community should be made aware of the differences between WTA and a common subsidy or a grant which they had received/are receiving as the main purpose of WTA is to compensate the lost utility while other forms of grants and subsidies are for upliftment of their present living standard.
CONCLUSION
As the open-dug wells are an important source of water for drinking and domestic purposes in the considered area, a high value for WTA could be expected, compared to other provinces in the country. Meanwhile, the government can urge the company who was responsible for the pollution to pay the correct monetary equivalent value for the victims, instead of the underestimated-blanket value for the whole area. Calculated WTA can be compared with the WTA values of similar studies (past values need to be adjusted for inflation before comparison) conducted within the country and the studies conducted in developing countries in the region. On the other hand, obtained values could be compared with the direct method of calculation (e.g., loss of earning due to health damage can be calculated using the mean income of the households depending on their main and secondary sources of income) for reliability checking.
SIGNIFICANCE STATEMENT
Correct approximation of the WTA value should reflect the true utility reduction of the affected individuals due to pollution. Hereby, underestimation or overestimation of the cost of pollution can be avoided. As a future measure, the responsible authorities who are conducting the Environment Impact Assessments (EIA) should be provided with existing WTA values, for them to use as base values in calculating benefit/cost analysis when approving the similar projects.
REFERENCES
- Khan, M.R., 2015. Polluter-pays-principle: The cardinal instrument for addressing climate change. Laws, 4: 638-653.
- Cane, P., 2001. Are environmental harms special? J. Environ. Law, 13: 3-20.
- Liyanage, G.I.M., 2017. Applicability of the international environmental law principles to the Sri Lankan environmental laws: Special reference to principle of polluter pays and inter generational equity. South East Asia J. Contemp. Bus. Econ. Law, 14: 70-75.
- Luppi, B., F. Parisi and S. Rajagopalan, 2012. The rise and fall of the polluter-pays principle in developing countries. Int. Rev. Law Econ., 32: 135-144.
- Chipman, J.S. and G. Tian, 2012. Detrimental externalities, pollution rights, and the "Coase theorem". Econ. Theory, 49: 309-327.
- Hahnel, R. and K.A. Sheeran, 2009. Misinterpreting the Coase theorem. J. Econ. Issues, 43: 215-238.
- Li, X., W. Liu, Y. Yan, G. Fan and M. Zhao, 2019. Rural households’ willingness to accept compensation standards for controlling agricultural non-point source pollution: A case study of the Qinba Water source area in Northwest China. Water, 11.
- Athukorala, W., 2013. Health benefits and industrial air pollution: A comparison between people’s willingness to accept and the opportunity cost of health risk. Sri Lankan J. Agric. Econ., 14-15: 43-58.
- Kularatne, R.K.A., 2020. Sri Lanka’s legal framework for marine pollution control: An evaluation of the Marine Pollution Prevention Act, No. 35 of 2008. J. Indian Ocean Reg., 16: 244-267.
- Perman, R., Y. Ma, M. Common, D. Maddison and J. Mcgilvray, 2003. Natural Resource and Environmental Economics. 3rd Edn., Pearson Education, London, England, ISBN-13: 9780273655596, Pages: 699.
- Gamage, C.D., Y. Sato, R. Kimura, T. Yamashiro and C. Toma, 2020. Understanding leptospirosis eco-epidemiology by environmental DNA metabarcoding of irrigation water from two agro-ecological regions of Sri Lanka. PLoS Negl. Trop. Dis., 14.
- Harrington, W. and P.R. Portney, 1987. Valuing the benefits of health and safety regulation. J. Urban Econ., 22: 101-112.
- Alberini, A. and A. Krupnick, 2000. Cost-of-illness and willingness-to-pay estimates of the benefits of improved air quality: Evidence from Taiwan. Land Econ., 76: 37-53.
- Gujarati, D., 2003. Basic Econometrics. 4th Edn., McGraw-Hill, New York, ISBN: 9780071123426, Pages: 1002.
How to Cite this paper?
APA-7 Style
Jayamini Champika,
P.A. (2024). Enabling Polluter-Pays Principle: Integrating Valuation for Groundwater Pollution in Chunnakam-Jaffna. Trends in Applied Sciences Research, 19(1), 20-27. https://doi.org/10.3923/tasr.2024.20.27
ACS Style
Jayamini Champika,
P.A. Enabling Polluter-Pays Principle: Integrating Valuation for Groundwater Pollution in Chunnakam-Jaffna. Trends Appl. Sci. Res 2024, 19, 20-27. https://doi.org/10.3923/tasr.2024.20.27
AMA Style
Jayamini Champika
PA. Enabling Polluter-Pays Principle: Integrating Valuation for Groundwater Pollution in Chunnakam-Jaffna. Trends in Applied Sciences Research. 2024; 19(1): 20-27. https://doi.org/10.3923/tasr.2024.20.27
Chicago/Turabian Style
Jayamini Champika, Pasdunkorale, Arachchige.
2024. "Enabling Polluter-Pays Principle: Integrating Valuation for Groundwater Pollution in Chunnakam-Jaffna" Trends in Applied Sciences Research 19, no. 1: 20-27. https://doi.org/10.3923/tasr.2024.20.27

This work is licensed under a Creative Commons Attribution 4.0 International License.