Geochemical Characterization of the Sources and Distribution of Fatty Acids in Recent Sediment Cores from Cross River System, South-South, Nigeria
-
Inyang Okon Oyo-Ita
Environmental/Organic Geochemistry Research Group, Department of Pure and Applied Chemistry, University of Calabar, Calabar, Cross River State, Nigeria
Ikip Ofem EkpoEnvironmental/Organic Geochemistry Research Group, Department of Pure and Applied Chemistry, University of Calabar, Calabar, Cross River State, Nigeria
Unyime Umoh UmohDepartment of Geology, Saint Mary’s University, Halifax, Nova Scotia B3H 3C3, Canada
Orok Esu Oyo-Ita

State Key laboratory of marine Geology, School of Ocean and Earth Science, Tongji University, Shanghai, China
| Received 05 Jan, 2024 |
Accepted 10 Jun, 2024 |
Published 11 Jun, 2024 |
Background and Objective: Fatty acids have been utilized to trace organic matter source, fate and fluxes transmitted between estuaries, rivers, tributaries and their drainage basins worldwide. However, such correspondence is scarce in Sub-Saharan African region, particularly in sediment cores of Cross River system. A comparative evaluation of recent sediment cores (50 cm long) from the upper and lower Cross River system, was undertaken to characterize the sources, distributions and fate of fatty acids. Materials and Methods: These were achieved by solvent extraction, purification, identification/quantification using gas chromatography-mass spectrometry and principal component analysis-multiple linear regression statistics. Dispersion of fatty acid classes followed the trends short-chain>long-chain>branched-chain>monounsaturated fatty acids for the upper system and short-chain>branched-chain>long-chain>monounsaturated for the lower. Results: Principal component analysis-multiple linear regression apportioned 53.14% to a mixed source of phytoplankton (dinoflagellate), heterotrophic bacteria and terrestrial plant (Rhizophora avicennia) and 48.86% to a mixed source of phytoplankton (diatom) and photosynthetic bacteria in the case of the upper system. For the lower, a mixed source of phytoplankton (dinoflagellate), heterotrophic bacteria and terrestrial plant Nypa fruticans made the larger contribution of 93.32%, while photosynthetic bacteria and terrestrial plant metabolites contributed 6.68% to the total fatty acids flux. The irregular fatty acids distribution patterns observed down cores were attributed to differences in the water depth, sediment texture, biodegradation and depositional environmental conditions. Conclusion: Detection of considerable levels of bacterial fatty acids suggested the involvement of an essential aerobic/anaerobic microbial activity and operation of varying biogeochemical processes at these sites.
| Copyright © 2024 Oyo-Ita et al. This is an open-access article distributed under the Creative Commons Attribution License, which permits unrestricted use, distribution, and reproduction in any medium, provided the original work is properly cited. |
INTRODUCTION
Autochthonous contributions from primary production and allochthonous inputs from terrigenous sources including soils, vascular plant debris and contaminants from anthropogenic activity are the major flux of organic carbon (OC) to the sediments of the estuarine systems1-3. Estuaries support a profuse variety of flora and fauna due to the considerable accumulation of organic matter (OM). Wastewater discharge and surface runoff from cultivated land increase nutrient levels in aquatic systems, aiding eutrophication, blossom of cyanobacteria and resultant reduction in aquatic macrophytes4.
Fatty acids (FAs) are a class of lipids used as tracers to get insight into the sources and fate of OM as well as trace fluxes transmitted between estuaries, rivers, tributaries and their drainage basins1,5-7. Various FA groupings and indices have been used by many researchers to differentiate and discriminate among terrestrial, phytoplanktonic, zooplanktonic and bacterial-derived sources8-10. In the study, FAs were effectively utilized to quantify source contributions and infer degradation pathways of OM in the sediment cores. There is a scarcity of data with respect to the distribution, fate, production and delivery of FAs in sediment cores of Sub-Saharan African tropical environments, particularly in the Cross River system. Also, for the first time the study examined the vertical variability of bulk elemental (TOC, TN, TOC/TN) and FA proxies in the system.
The principal objectives of the present investigation include: Ascertaining the relationship between fatty acids and sediment bulk properties, delineating the vertical distribution of fatty acids to evaluate their biogeochemistry and differentiating and apportioning various fatty acids to sources for future conceptual modelling of the distribution of allochthonous and autochthonous OM in the system.
MATERIALS AND METHODS
Study area: The Cross River system lies in Latitude 40 54' and 80 5'N and Longitude 80 00' and 100 20E in the South-South Niger Delta of Nigeria, encompassing an area of 53,000 km2, with about 14,000 km2 and 39,000 km2 located in Cameroon and Nigeria, respectively. Influx of organic species into the system is influenced by the Great Kwa River, Cross River and the Calabar River tributaries. There is also the contribution of two ocean currents, northward rising Benguela and eastward flowing Guinea current. The river system is typified by the interaction of freshwater and estuarine seawater frontal system, toward the mouth of the river that is archetypal of a delta coastal zone. Comprehensive information on its geology and environmental features is reported by Pisani et al.11.
The Cross River system was divided into two different zones, the upper system (US 8015'E and 4055'N) and the lower system (LS 8020'E and 4025'N). Each zone was made up of one sediment core sample (50 cm long), separated from each other by a distance of about 70 km, each sectioned into 10 portions of 5 cm intervals. All cores were obtained during July, 2022 with a calibrated PVC corer and wrapped with pre-cleaned Al foil, stored in a cooler containing ice and preserved at -4°C in a refrigerator until further processing in the laboratory. During pre-analytical procedure, the cores were homogenized, using an agate mortar and pestle and freeze-dried until analysis.
Materials and quality control/assurance: Dichloromethane, isooctane, acetone and methanol purchased from Shaghai Ruizheng Chemical Technology Ltd., China were double-distilled before being used. Other chemicals used were chromatographic grade n-hexane and Bis (trimethylsilyl) trifluoroacetamide (BSTFA-Merck, Germany) from Sigma Aldrich (St Louis, Missouri, USA). Silicagel 40 (0.063-0.200 mm), anhydrous and aluminium oxide 90 active neutral (0.063-0.200 mm) were also purchased from Merck. The silica and alumina were activated by heating for 12 hrs at 120 and 350, respectively. Five percent Milli-Q-grade water was then added to the adsorbents to deactivate them. Surrogate standards including a methyl nonadecanoate (C19 FAME), fatty acid methyl ester (FAME), myristyl arachidate that yielded a C14 alcohol and a C20 FA following saponification, n-alkanoic acids and n-C22 alkanes also used as internal standards for FAMEs and neutral lipids fractions respectively was purchased from Merck, Hohenbrunn, Germany.
All glassware was cleansed with distilled water, followed by acetone and heated to about 450°C for 6 hrs. Thereafter rinsed with ultra-pure dichloromethane and methanol. Alumina (70-230 mesh-Merck), neutral silica gel (70-230 mesh, Merck) and sodium sulphate were extracted with (1:2, v/v) MeOH-dichloromethane (DCM) in a Soxhlet apparatus for 24 hrs. Glassware was wrapped in aluminum foil after rinsing with acetone and placed in an oven at 60°C for 2 hrs. A range of 0.5 to 10 ppm concentrations of standard mixtures were injected per batch of samples.
pH, grain size and elemental determination: The pH of sediment samples was measured in the supernatant suspension of a 1:5 (sediment: liquid) (w/v) mixture using the pH meter following procedures described in Oyo-Ita et al.14.
Laser particle sizer (LS 200, Berkmann-Coulter with a mesh range of 0.375-1000 lm) was used in the determination of sediment grain size12. The DE carbonation of freeze-dried samples with 2M HCl was performed repeatedly until bubbling stopped and then rinsed in deionized water to a neutral pH. Duplicate analysis was performed on the finely decarbonated sample for Total Organic Carbon (TOC)) and nitrogen (TN) using Thermo Finnigan FLASH 1112 elemental analyzer.
Extraction and purification: The homogenized samples were spiked with C19:0 FA and C19FA and extracted 3x by sonication at 10.34 MPa (1400 psi.) with MeOH, DCM and n-hexane. Extracts were desulphurized and saponified with 30 g activated copper (copper immersed in 20 mL of 0.1M concentrated hydrochloric acid for ten minutes) and 30 mL KOH (6%) in MeOH for 2 hrs at 75°C, respectively. The neutral fraction was obtained by extracting with 3×30 mL n-hexane13.
About 5 mL of HCl was used to acidify the alkaline mixture to pH 2 and the resultant acidic compounds were obtained by extracting with 3×30 mL n-hexane. Aliquots of the total extracts were derivatized by reaction with N,O-bis-(trimethylsilyl)trifluoroacetamide (BSTFA) and pyridine for 3 hrs at 70°C to trimethylsilyl prior to Gas Chromatography-Mass Spectrometry (GC-MS) analysis.
Instrumental analysis: Analysis of the FAs was accomplished using a GC–MS with an Agilent 7890A GC instrument interfaced to an Agilent 5975C quadrupole mass selective detector (MSD), with electron ionization (70 eV). The FAs were separated on a fused silica column (Agilent J&W DB-5 ms; 30 m_0.25 mm i.d., 25 mm film thickness). Helium was used as a carrier gas at 1.5 mL/min. A sample of 1 μL was injected using an on-column injector when the injector temperature was maintained at 300°C. The temperature of the detector was maintained at 325°C.
The injector temperature was kept at 280°C in splitless mode and after injection, the purge valve was energized for 50 sec. Temperature of the column was kept at 60°C for 1 min and raised to 200°C at 10°C for 1 min and finally to 320°C at 4.8°C for 1 min and kept at that temperature for 10 minutes. Transfer line and Ion source temperatures were 250 and 200°C, respectively. Data were acquired in the SIM mode from 50 to 350 amu (10 scans per second) with 6 min of solvent delay and made possible by the X-calibur Thermo Finnigan software. Identification and quantification of FAs were carried out with reference to external standards C-19:0 FA methyl ester. The levels of FAs in nanogram per gram sample were calculated from the peak areas in the TIC traces.
Statistical analysis: The mean and standard deviation values were calculated for the generated data set (n = 20). These sets of data were also analyzed by Pearson correlation model to understand the relationship between paired variables and Principal Component Analysis (PCA), employed to describe variance of observed data in a geochemical environment. This multi-variate approach tackles a large proportion of variables simultaneously and has been used by environmentalists to ascertain organic matter degradation and sources in aquatic systems10.
Multiple linear regression (MLR) is a quantitative approach used to determine the source contribution by extracting the principal components with eigenvalues greater than 1, performing regression analysis on the factor analysis results and calculating the contributions of different sources10. Microsoft Excel computer package and SPSS 8.0 was used for all statistical analyses.
RESULTS AND DISCUSSION
The procedural blanks used for the sediment samples analysis revealed no fatty acids. The accuracy and reproducibility of analytical methods were apt and satisfactory. The percentage recoveries of the C12-C28 fatty acids were high (70-90%) and the relative standard deviations were <20%. Comparatively, these results were in line with the acceptable criteria as indicated by Hu et al.24.
Sediment bulk properties: Results of bulk characteristics which include pH, grain size distribution, Total Organic Carbon (TOC) and total nitrogen (TN) as well as environmental features of the Cross River system are presented in Table 1 and 2 for the US and LS, respectively. The pH, TOC, TN and grain size distribution did not only differ between the two cores but also within each core. These variations may influence the FA distributions in the two cores. Values of pH for the US were in the range 6.13-7.57 (Mean = 6.97±0.4) with a minimum found at the top layer (0-5 cm) and a maximum at the bottom (45-50 cm), while those for the LS were in the range 6.51-7.70 (Mean = 7.04±0.38) with a minimum at the top layer (0-5 cm) and a maximum at the near-bottom layer (40-45 cm). The relatively lower pH recorded for the US relative to the LS may be due to the proximity of the former to mangrove stands where decomposition from litter enhances the release of different kinds of organic acids14.
Generally, the cores were composed predominantly of sand fractions, probably due to the sheltered Niger Delta basin morphology and the apparent high tidal state of the system1. The sand fractions for the US were in the range of 43.98-63.80 and 52.94-67.14% for the LS. The silt fractions ranged from 18.75 to 37.04%, while the clay fractions were in the range 6.80-13.46% with corresponding mean values of 54.66±6.33, 30.19±7.16 and 9.31±2.19%, respectively for the US and 58.77±4.77, 29.56±4.52 and 12.97±2.58%, respectively for the LS. The minimum percentage sand fraction was found at the middle layer (10-15 cm) of US and the maximum was recorded at the near-bottom layer (40-45 cm) in the LS. Also, the minimum percentage silt fraction was found at the middle layer (10-15 cm) in US, while the maximum was recorded at 30-35 cm of LS. However, in the case of percentage clay fraction, the minimum value was found at the top layer (0-5 cm) of US and a maximum at the bottom layer (45-50 cm) of LS.
The TOC concentrations of the cores reflected allochthonous influx from eroded soils and leaf liters and autochthonous production. The TOC contents were typical of a coastal environment and ranged from 2.52% at 0-5 cm to 3.77% at 25-30 cm (Mean = 3.04±0.51%) for the US, while those for the LS ranged from 1.33% at 5-10 cm to 2.28% at 30-35 cm (Mean = 1.897±0.41%). The observed irregularity in TOC distributions down cores may be associated with variations in the quantity and quality of OM burial over specified geologic timeframes. Moreover, the observed higher TOC content in the US relative to the LS most likely reflected a higher influx of OM from allochthonous owing to the proximity of the former to shoreline as well as its higher clay lithology with a good adsorbability capacity to accumulate OM1 and probable predominant anoxic condition of the former. In addition, the observed cloudy nature of the lower system water (estuary-where LS core was collected) with relatively higher suspended particulate matter load reduced light penetration in the water column, thus, limiting photosynthetic process and leading to a decline in primary productivity. Generally, sediment with higher proportions of clay/silt has higher TOC content than sandy type with low TOC. In the study, relationship between TOC and percentage clay/silt was established with correlation coefficients of r = 0.472 and r = 0.193 recorded for the US and LS, respectively. These results indicated a better capacity of the US to accumulate OM than the LS.
| Table 1: | Characteristic features of the environment and sediment bulk properties for the upper Cross River system sediment core | |||
| Sample | Depth (cm) | Coordinate | Environmental features | pH | Sand (%) >0.1 mm |
Silt (%) >0.05 mm |
Clay (%) >0.003 mm |
Clay/silt (%) | TOC (%) | TN (%) | Water column (m) |
| US1 | 0-5 | Latitude 4°55'N | Partially influenced by boat | 6.13 | 43.98 | 20.18 | 12.28 | 0.61 | 2.52 | 0.21 | 7 |
| US2 | 05-Oct | Longitude 8°15'E | traffic/industrial inputs and | 6.31 | 47.71 | 18.75 | 9.26 | 0.49 | 2.81 | 0.2 | |
| US3 | Oct-15 | the shores are covered mainly | 6.82 | 55.67 | 28 | 13.46 | 0.48 | 2.45 | 0.13 | ||
| US4 | 15-20 | by Rhizophora avicennia | 7.19 | 50.12 | 32.08 | 8.2 | 0.26 | 2.35 | 0.15 | ||
| US5 | 20-25 | 6.9 | 52.32 | 42.53 | 8.15 | 0.19 | 3.25 | 0.21 | |||
| US6 | 25-30 | 7 | 54.14 | 37.6 | 10.44 | 0.28 | 3.45 | 0.2 | |||
| US7 | 30-35 | 7.3 | 57.42 | 33.04 | 9.56 | 0.29 | 2.5 | 0.16 | |||
| US8 | 35-40 | 7.4 | 63.8 | 31.8 | 7.82 | 0.25 | 3.28 | 0.23 | |||
| US9 | 40-45 | 7.32 | 62.5 | 28.11 | 7.15 | 0.25 | 3.39 | 0.22 | |||
| US10 | 45-50 | 7.57 | 58.9 | 29.9 | 6.8 | 0.23 | 3.77 | 0.27 | |||
| Range | 6.13-7.57 | 43. 98-63.80 | 18.75-37.04 | 6.80-13.46 | 0.19-0.61 | 2.35-3.77 | 0.13-0.27 | ||||
| Mean | 6.97 | 54.66 | 30.19 | 9.31 | 0.33 | 3.04 | 0.198 | ||||
| SD | 0.47 | 6.33 | 7.16 | 2.19 | 0.14 | 0.508 | 0.04 | ||||
| N/B: TOC: Total Organic Carbon, TN: Total nitrogen, US: Upper cross river system and SD: Standard deviation | |||||||||||
| Table 2 | Characteristic features of the environment and sediment bulk properties for the lower Cross River system sediment core | |||
| Sample | Depth (cm) | Coordinates | Environmental features | pH | Sand (%) >0.1 mm |
Silt (%) >0.05 mm |
Clay (%) >0.003 mm |
Clay/silt (%) | TOC (%) | TN (%) | Water column (m) |
| LS1 | 0-5 | Latitude 4°56'N | Discharges of sewage and | 6.51 | 53.82 | 28.38 | 15.28 | 0.53 | 2.22 | 0.13 | 12 |
| LS2 | 05-Oct | Longitude 8°16'E | sludge, industrial effluents, | 6.62 | 52.94 | 30.59 | 15.47 | 0.51 | 1.31 | 0.1 | |
| LS3 | Oct-15 | fallout and washout from the | 6.82 | 58.99 | 27.45 | 14.8 | 0.54 | 1.45 | 0.12 | ||
| LS4 | 15-20 | atmosphere, increased | 6.74 | 58.72 | 34.12 | 14.36 | 0.42 | 2.25 | 0.16 | ||
| LS5 | 20-25 | anthropogenic input due to | 6.94 | 54.11 | 29.18 | 12.27 | 0.42 | 2.21 | 0.17 | ||
| LS6 | 25-30 | high population density, boat | 7.4 | 55.22 | 28.44 | 13.64 | 0.48 | 1.4 | 0.08 | ||
| LS7 | 30-35 | and ship population and high | 7.17 | 60.56 | 39.23 | 15.22 | 0.39 | 1.55 | 0.09 | ||
| LS8 | 35-40 | salinity and as well as dense | 7.2 | 63.47 | 26.81 | 10.72 | 0.4 | 2.28 | 0.15 | ||
| LS9 | 40-45 | Nypa fruticans and sparse | 7.3 | 62.8 | 22.26 | 8.8 | 0.4 | 2.19 | 0.13 | ||
| LS10 | 45-50 | Rhizophora racemosa | 7.7 | 67.14 | 29.15 | 9.16 | 0.31 | 2.11 | 0.15 | ||
| Range | 6.51-7.70 | 52.94-67.14 | 27.45-39.23 | 9.16-15.47 | 0.31-0.54 | 1.33-2.28 | 0.08-0.17 | ||||
| Mean | 7.04 | 58.77 | 29.56 | 12.97 | 0.44 | 1.897 | 0.13 | ||||
| SD | 0.38 | 4.77 | 4.52 | 2.58 | 0.073 | 0.41 | 0.02 | ||||
| N/B: TOC: Total Organic Carbon, TN: Total bitrogen, LS: Lower cross river system and SD: Standard deviation | |||||||||||
Comparing data with those reported for other aquatic sedimentary environments worldwide showed that the TOC contents for the studied cores were higher than those reported for sediment from the Imo River system (0.19-1.64%)1, while comparable TOC contents were recorded for sediment cores from Gabu Lake, SE Nigeria (1.9-2.9%)15 and Germlik Bay, Turkey (0.73-3.05%)16. According to these authors, increased TOC levels were found in sediments from a deep trough area compared to those from shallow areas, revealing the significance of water depth as an element that may influence the buildup of OM in aquatic environments. Much lower TOC contents in the range of 0.32-0.95% were documented for Yangste River with similar water depth to that of the study area, reflecting the higher capacity of the studied sediment to accumulate OM. On the other hand, Ak et al.17 reported much higher TOC values in the range of 2-13% for sediments from Pulau, Tinggi, Malaysia and attributed these varied values to a higher contribution of terrestrial OM and differences in sediment grain size distribution. Camacho-Ibar et al.18 reported TOC values at the top section of deeper sediment cores from Northern Gulf of California (NGC) to be relatively low despite the high primary productivity of the Gulf. These low values, particularly at the shallow Vago site (ca. 5.5%) were attributed to extreme degradation of OM in the water column prior to sequestration and a dilution effect by way of addition of carbon-depleted sediment particles disintegrated from the Colorado River Delta (CRD). In contrast, the top section of deeper marine sediment cores from the Peruvian shelf had higher TOC concentration (ca. 90 mg/g), attributable to high primary productivity19. It appears therefore that natural condition of sediments, biological productivity, surrounding environment, sedimentation rate and diagenetic process as well as water depth are factors that influence the sedimentary organic carbon content in the study.
TN concentrations in sediments may imply higher input of aquatic flora, particularly in an environment where bedrock mineralization and usage of fertilizer are absent20. The TN contents for the US ranged from 0.13% at 45-50 cm to 0.27% at 10-15 cm (Mean = 0.198±0.04). In the case of LS, TN contents were in the range of 0.08-0.17% (Mean = 0.13±0.02) with a minimum of 40-45 cm and a maximum of 20-25 cm (Table 1 and 2). There was no consistent trend observed in TN dispersion down cores, reflecting variations in the quality and quantity of aquatic flora deposition over the years.
In order to use TOC/TN ratio as an indicator to track the sources of sedimentary OM, it was presumed that TN in sediments should sorely exist as N bonded to OM, thus expected to lead to a significant correlation between TOC and TN21. In the present study, the relationship between TN and TOC for the US (r = 0.8379) and LS (r = 0.8512) was significant. This implies that TN in the two cores contributed significantly to organic matter in the sediment. Therefore, because of this strong relationship, TOC/TN ratio was used as an identifier of OM sources in the cores.
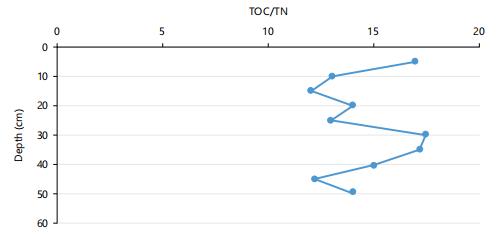
The TOC/TN values for the US were in the range of 13.9630-18.0769 (Mean = 16.02±2.09) with a minimum at 15-20 cm and a maximum at 45-50 cm, while those for the LS were in the range of 13.1-15.2 (Mean = 14.15±1.9), minimizing at 5-10 cm and maximizing at 35-40 cm (Fig. 1). The TOC/TN values between 4 and 10 have been linked to fresh OM from algae, which are protein-abundant and cellulose-deficient, while vascular land plants that are cellulose-abundant and protein deficient, produce OM with TOC/TN values of 20 and above14. Present results showed intermediate TOC/TN values, revealing an admixture of an almost equal proportion of aquatic flora (e.g., algae/bacteria) and terrestrial vascular plants tend more towards aquatic OM sources.
However, the distributional trends down cores indicated higher values in the US than in LS, attributed to a decline in the seaward burial of terrestrial OM, which may also be dependent on the differences in depositional environmental conditions and hydrodynamics of the two sites.
|
|
Fatty acids distribution and fate in sediment cores: In the study, 23 fatty acids (FAs) in the range C12-C28 with an even over odd carbon numbered predominance were detected in the two cores including saturated n-FAs such as C12-dodecanoic, C13-tridecanoic, C14-tetradecanoic, C15-pentadecanoic, C16-hexadecanoic, C17-heptadecanoic, C18-octadecanoic, C19-nanodecanoic, C20-icosanoic, C21-heneicosanoic, C22-docosanoic, C23-tricosanoic, C24-tetracosanoic, C25-pentacosanoic, C26-hexacosanoic, C27-heptacosanoic and C28-octacosanoic acids which were the main compounds detected. Others are the branched chain (e.g., Ci13-iso-tridecanoic, Ci14-iso-tetradecanoic, Ci15-iso-pentadecanoic, Cai15-anteiso-pentadecanoic, Ci16-iso-hexadecanoic acids) and monounsaturated FAs (e.g., Ci16:1-hexadec-9-enoic acid) (Table 3 and 4).
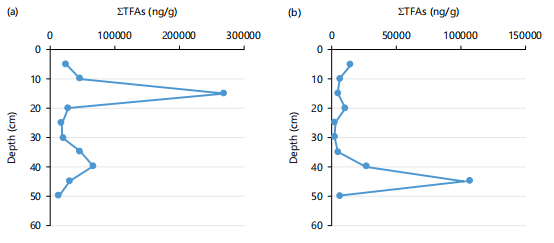
Total fatty acid (TFA) concentrations for the US were in the range 13621.1-270,757 ng/g dry weight (dw) (Mean = 56045±772 ng/g) with a minimum at 45-50 cm and a maximum at 10-15 cm, while those for the LS were in the range 2520.5-107136 ng/g dw (Mean = 818.31±318); a with minimum and maximum at 25-30 and 40-45 cm, respectively (Fig. 2a-b). The higher TFA concentrations in the US relative to the LS attributed to sediment textural differences, proximity of the former to shoreline leading to greater wash-in of terrigenous materials and higher microbial degradation in the latter occasioned by enhanced anthropogenic input (e.g., sewage discharge).
| Table 3: | Fatty acids concentrations in ng/g from the upper Cross River system sediments core | |||
| Fatty acid | US1 | US2 | US3 | US4 | US5 | US6 | US7 | US8 | US9 | US10 |
| C12 | 551.7 | 13079 | 20250.2 | 793.4 | 0.05 | 382.5 | Nd | 853.1 | 469 | 100.6 |
| Ci13 | 61.1 | 78.7 | 780.9 | 79.6 | 42.7 | 74.8 | Nd | 175.4 | 92.7 | 15.7 |
| C13 | 135.8 | 171.5 | 1703.3 | 177.5 | 80.1 | 111.6 | 237.9 | 233.6 | 121.1 | 25.2 |
| Ci14 | 0 | 402.8 | 4427.1 | 452.8 | 278.9 | 306.1 | 281.7 | 786.2 | 423.6 | 123.3 |
| C14 | 0 | 6139.1 | 26994.7 | 1976.8 | 1044.6 | 510.5 | 3181.5 | 3167.8 | 1492.4 | 500.7 |
| Ci15 | 743.4 | 914.4 | 10820.9 | 1061.9 | 707.1 | 1296.2 | 3343.7 | Nd | 1786.6 | 548.1 |
| Ca15 | 570.5 | 711.6 | 6877.7 | 900.7 | 658.1 | 1050.7 | 2014.4 | Nd | 1103.2 | 599.3 |
| C15 | 1069.5 | 920.6 | 9331.8 | 979.9 | 527.1 | 720.9 | 1646.8 | Nd | 992.9 | 311.3 |
| Ci16 | 548.7 | 647.9 | 6262 | 686.1 | 652.2 | 712.8 | 1853.7 | 4722 | 1278.4 | 407 |
| C16:1 | 448.2 | 409.5 | 3182.3 | 400.1 | 290.6 | 309.1 | 845.1 | 2152.8 | 674.6 | 204.8 |
| C16 | 8560.6 | 11118.7 | 92398.9 | 8994.3 | 5620.2 | 6076.8 | 15322 | 39031 | 11882.7 | 4206.2 |
| C17 | 470.2 | 446.8 | 4106.4 | 488.5 | 356 | 346.8 | 939.2 | 1071.9 | 656.9 | 271.9 |
| C18 | 1798.3 | 2767.3 | 3287.4 | 2063.3 | 1469.7 | 1590.1 | 3428.3 | 2163.3 | 1877.9 | 1269.5 |
| C19 | 81.2 | 102.8 | 434.8 | 125.4 | 118.3 | 126.3 | 152.3 | Nd | 231.7 | 174.3 |
| C20 | 776.7 | 730.3 | 6927.8 | 870.9 | 503.9 | 1034.1 | 2930.1 | 3385.9 | 2662.8 | 742.1 |
| C21 | 240.2 | 220.9 | 1698.9 | 217.6 | 174.7 | 127.2 | 378.7 | Nd | 388.6 | 200.9 |
| C22 | 2008.2 | 1981.1 | 16863.1 | 1819.1 | 211 | 920.4 | 2770.8 | 368.3 | 2710.5 | 1041 |
| C23 | 351.3 | 372.9 | 3282.1 | 358.7 | 201.9 | 207.4 | 695.8 | 3135.9 | 111.4 | 287 |
| C24 | 3098.6 | 2882.3 | 27576.5 | 2773.1 | 2067.8 | 1046.2 | 3368.3 | 2122.7 | Nd | 1314 |
| C25 | 236.5 | 237.6 | 2425.4 | 138.8 | 217.9 | 99.8 | 347.5 | 317.7 | 90.8 | 142.3 |
| C26 | 1741.8 | 1491.9 | 14288.1 | 1625.5 | 1271.3 | 491.1 | 2116.1 | 1862.2 | 424.9 | 817.1 |
| C27 | 119.8 | 150.2 | 995.2 | 141.3 | 107.8 | 51.9 | 174.7 | 197.3 | 0 | 99.3 |
| C28 | 700.8 | 590 | 5841.8 | 602.2 | 556.6 | 150.6 | 652.7 | 548.9 | 112.9 | 225.3 |
| Mean | 1057.1 | 2024.7 | 11772.1 | 1205.5 | 746 | 771.5 | 2029.6 | 2882.4 | 1286.3 | 592.2 |
| Nd: Not detected | ||||||||||
| Table 4: | Fatty acids concentrations in ng/g from the Lower Cross River systems sediments core | |||
| Fatty acid | LS1 | LS2 | LS3 | LS4 | LS5 | LS6 | LS7 | LS8 | LS9 | LS10 |
| C12 | 353.5 | 170.8 | 114.1 | 260.1 | 51.9 | 49.2 | 168.2 | 954.7 | 4350.6 | 114.4 |
| Ci13 | 89.6 | 52.8 | 41.1 | 54.9 | 40.4 | 38.5 | 92.9 | 165.3 | 597.4 | 54.9 |
| C13 | 178.9 | 64.5 | 36.1 | 72.8 | 23.1 | 22.5 | 54.1 | 227.9 | 1419.5 | 49.4 |
| Ci14 | 424.4 | 255.8 | 144.4 | 252.9 | 59.4 | 50.7 | 188.8 | 1007.1 | 6210 | 133.7 |
| C14 | 1261.8 | 650.1 | 374.4 | 852.3 | 180.9 | 126.4 | 404.9 | 3039.3 | 21652.4 | 461.9 |
| Ci15 | 1393.8 | 830.7 | 448.6 | 875.8 | 176.4 | 108 | 271.5 | 1729.4 | 9857.6 | 238.1 |
| Ca15 | 1239.9 | 824.3 | 545.6 | 1152 | 410.1 | 270.9 | 489.5 | 1957.7 | 7203.7 | 543.7 |
| C15 | 1024.5 | 312.1 | 163.6 | 417.1 | 74.9 | 62.2 | 133.6 | 899.4 | 5485.6 | 175.6 |
| Ci16 | 640.7 | 350.5 | 225.7 | 426.9 | 78.9 | 41.9 | 141.2 | 1111.8 | 4177.8 | 173.9 |
| C16:1 | 462.4 | 217.5 | 120.8 | 166.8 | 45.9 | 15.8 | 30.5 | 166.9 | 362.1 | 23.2 |
| C16 | 5258.7 | 1984.4 | 1490.8 | 3489.1 | 826.2 | 542.8 | 1193.2 | 10250.4 | 35489.5 | 2289.4 |
| C17 | 326.9 | 117.7 | 118.4 | 182.5 | 79.8 | 71.2 | 95.8 | 511 | 741.9 | 129.1 |
| C18 | 794.3 | 251.6 | 350 | 584.6 | 231.7 | 302.2 | 309.9 | 1768.3 | 2008 | 583.4 |
| C19 | 108.2 | 110.4 | 121.9 | 115.3 | 119.7 | 60.6 | 153.6 | 488.5 | 248.6 | 159.1 |
| C20 | 176.2 | 50.4 | 77.1 | 232.9 | 75.8 | 117.9 | 95.9 | 309 | 558.8 | 159.3 |
| C21 | 67.5 | 47.8 | 59.3 | 894.1 | 78.8 | 122.5 | 91.2 | 358 | 459.3 | 171.1 |
| C22 | 232.2 | 103.8 | 145.4 | 160.5 | 105 | 165.6 | 231.1 | 470.4 | 1339.9 | 296.8 |
| C23 | 43.4 | 21.2 | 33.7 | 63.3 | 27.6 | 36.5 | 55.1 | 123.6 | 322.8 | 115.8 |
| C24 | 134.7 | 41.9 | 76.9 | 120.9 | 61.9 | 63.5 | 109.8 | 312.6 | 1452.8 | 359.3 |
| C25 | 56.4 | 25.1 | 45.7 | 84.5 | 47 | 53.6 | 92.8 | 456.8 | 710.3 | 133.9 |
| C26 | 61.9 | 21.7 | 46.3 | 73.5 | 35.2 | 72.4 | 128.8 | 295.2 | 829.7 | 260.3 |
| C27 | 48.1 | 31.8 | 55.2 | 69.4 | 50.5 | 63.1 | 166.3 | 450.9 | 655.5 | 153.2 |
| C28 | 34.1 | 31.4 | 35.8 | 90.7 | 50.9 | 62.5 | 85.3 | 202.6 | 1002.3 | 303.5 |
| Mean | 626.6 | 285.6 | 211.8 | 464.9 | 127.5 | 109.6 | 207.9 | 1185.1 | 4658.1 | 306 |
Positive correlations existed between TFA concentrations and TOC for the US (r = 0.4081) and LS (r = 0.3710), indicating not only moderate contributions of fatty acids of various origins to the sedimentary organic carbon (OC) but also supported higher contribution of fatty acids of terrestrial origin to the former than the later. The TFAs showed notable irregular trends in their vertical distributions for the two cores (Fig. 2a-b). These irregularities may be due to differences in the water depth, primary productivity, redox potential, extent of biotic/abiotic degradation and bioturbation as well as physical
mixing during tidal excursions and storms that can lead to redistribution of FAs much more in the lower system10. For instance, the higher water depth of LS provides more time for indigenous microbial-mediated degradation to be enhanced, leading to a decline in the levels of FAs. The role water depth played is supported by the fact that near absence of oxygen in deep waters does not enhance abiotic and biotic degradation compared to shallow waters of high oxygen level9.
Furthermore, the lower TFA levels recorded for the sediment from the coastal zone of Ras Abu El-Darag, Gulf of Suez in relation to those recorded for the present study was associated with deeper water depth of the former (55 m)22. A similar scenario was observed in sediment from China with a much deeper water depth (970 m) that exhibited very low TFA levels (5.14-8.99 ng/g)23. Moreover, despite the comparable water depth of the study area with that of the Lmo River, Nigeria (18 m; 1223-4460 ng/g)1 and Pearl River Estuary, Southern China (10 m; 1280-42250 ng/g)24, the Cross River system sediment still recorded higher TFA levels. However, anoxic conditions may decrease the rate of OM degradation resulting in an increased FA concentration and this may be responsible for the higher TFA concentrations recorded for the surface sediments of mangrove ecosystems in the Northern Kerala Coast, India (10 m; 6250-580490 ng/g)10. Therefore, this scenario agreed with various studies which give supportive proof that shallow water depths (<50 m) favor enhanced TFA buildup in sediments9,22.
The least abundant FAs, Ci13:0 in the range 15.7-780.9 ng/g dw (Mean = 140.16±23.05 ng/g) and C23 in the range 21.2-322.8 ng/g (Mean = 84.3±90 ng/g), were detected in the US and LS, respectively, with corresponding minimum/maximum at 45-50/10-15 cm and 5-10/40-45 cm. The most abundant FA detected in both cores was C16:0 which ranged from 4206.2 ng/g at 45-50 cm to 92399 ng/g at 15-20 cm (Mean = 20321.14±272 ng/g) for the US (Table 3) and from 542.8 ng/g at 30-35 cm to 35489.5 ng/g at 40-45 cm (Mean = 6281.45±142 ng/g) for the LS (Table 4). The mean concentrations of Monounsaturated Fatty Acids (MUFAs) in the US and LS were 892±67 and 161±12 ng/g dw, respectively, suggesting in part that higher bacterial transformation of unsaturated to saturated FAs occurred in LS than in the US, probably due to the enhanced sewage discharge to the lower system. The percentage MUFA relative to TFA for the US ranged from 0.12% at 10-15 cm to 3.25% at 35-40 cm (Mean = 1.52%±1.31; Table 5), while those for the LS ranged from 0.33% at 45-50 cm to 4.41% at 5-10 cm (Mean = 1.46±0.98; Table 6).
| Table 5: | Percentage composition and geochemical ratios from the upper system sediments core | |||
| Parameter | US1 | US2 | US3 | US4 | US5 | US6 | US7 | US8 | US9 | US10 |
| i/a 15:0 | 1.3 | 1.28 | 1.57 | 1.17 | 1.07 | 1.23 | 1.66 | - | 1.62 | 0.91 |
| ΣC16/ΣC18 | 4.76 | 4.02 | 28.11 | 4.36 | 2.28 | 3.82 | 4.47 | 18.04 | 6.33 | 3.31 |
| 16:1/16:0 | 0.05 | 0.04 | 0.03 | 0.04 | 15.75 | 0.05 | 0.06 | 0.06 | 0.06 | 0.05 |
| TARFA | 0.61 | 0.16 | 0.34 | 0.43 | 0.58 | 0.24 | 0.33 | 0.11 | 0.49 | 0.32 |
| SCFA (%) | 55.3 | 76.2 | 61.1 | 59.4 | 56.7 | 61.4 | 59.6 | 75.3 | 68.9 | 55.8 |
| LCFA (%) | 34.7 | 17 | 27 | 27.7 | 28 | 17.4 | 22.5 | 12.9 | 13 | 30.3 |
| BCFA (%) | 7.9 | 0.6 | 10.8 | 11.5 | 13.6 | 19.4 | 16.1 | 8.6 | 15.8 | 12.4 |
| MUFA (%) | 1.84 | 0.83 | 0.12 | 0.14 | 1.69 | 1.74 | 1.81 | 3.25 | 2.28 | 1.5 |
| i/a 15:0: iso/anteiso-pentadecanoic, TARFA: Terrestrial aquatic ratio fatty acids, SCFA: Short Chain Fatty Acid, LCFA: Long Chain Fatty Acid, BCFA: Block chain fatty acid and MUFA: Monounsaturated Fatty Acid | ||||||||||
| Table 6: | Percentage composition and geochemical ratios of fatty-acids from the lower system sediments core | |||
| Parameter | LS1 | LS2 | LS3 | LS4 | LS5 | LS6 | LS7 | LS8 | LS9 | LS10 |
| i/a 15:0 | 1.12 | 1.01 | 0.82 | 0.76 | 0.43 | 0.4 | 0.55 | 0.88 | 0.37 | 0.44 |
| ΣC16/ΣC18 | 6.62 | 7.89 | 4.26 | 5.97 | 3.57 | 1.8 | 3.85 | 5.8 | 17.67 | 3.9 |
| 16:1/16:0 | 0.09 | 0.11 | 0.08 | 0.05 | 0.06 | 0.03 | 0.03 | 0.02 | 0.01 | 0.01 |
| TARFA | 0.03 | 0.03 | 0.08 | 0.06 | 0.14 | 0.28 | 0.18 | 0.06 | 0.05 | 0.32 |
| SCFA (%) | 65.8 | 56.5 | 58.4 | 58.1 | 56.8 | 53.8 | 54.5 | 67.7 | 67.2 | 57.9 |
| LCFA (%) | 4.7 | 4.9 | 10.2 | 14.6 | 15.6 | 25.4 | 20.1 | 9.8 | 6.3 | 25.5 |
| BCFA (%) | 26.3 | 35.2 | 28.9 | 25.9 | 26.1 | 20.2 | 24.8 | 21.9 | 26.2 | 16.3 |
| MUFA (%) | 3.11 | 3.31 | 2.48 | 1.56 | 1.56 | 0.63 | 0.63 | 0.61 | 0.34 | 0.33 |
| i/a 15:0: iso/anteiso-pentadecanoic, TARFA: Terrestrial aquatic ratio fatty acids, SCFA: Short Chain Fatty Acid, LCFA: Long Chain Fatty Acid, BCFA: Block chain fatty acid and MUFA: Monounsaturated Fatty Acid | ||||||||||
|
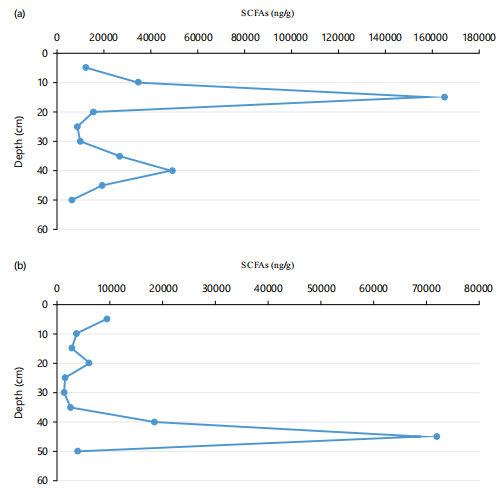
Linear saturated Short-Chain FAs (SCFAs; nC12:0-nC19:0) are universal in sediments and may come predominantly from algae and bacteria9. The SCFA concentrations for the US ranged from 7601 ng/g dw at 45-50 cm to 165435 ng/g dw at 10-15 cm (Mean= 35723±210), while those for the LS ranged from 1335 ng/g dw at 25-30 cm to 71955 ng/g dw at 40-45 cm (Mean=12265±197; Fig 3a,b). The percentage of SCFAs relative to TFA in the US was in the range 55.35-76.2% (Mean = 62.97±7.76%) with a minimum and maximum at 0-5 cm and 5-10 cm, respectively (Table 5) and those for the LS in the range 53.83-67.75% (Mean = 59.67±5.22%) with a minimum and maximum at 30-35 and 40-45 cm, respectively (Table 6). The vertical variations in compositions and concentrations of SCFAs were associated with the differences in the population of algae and aerobic/anaerobic bacteria deposition in both cores over specific geologic time frame.
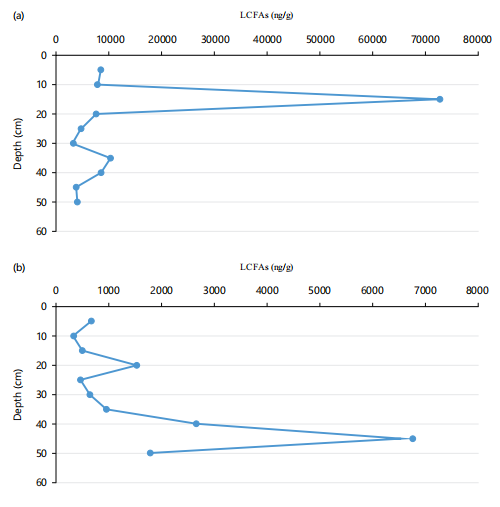
The saturated Long Chain FAs (LCFA; nC20-nC28) for the US ranged from 3094 ng/g dw at 25-30 cm to 72971 ng/g dw at 10-15 cm (Mean = 13199±20; Fig. 4a-b), while those for the LS ranged from 325 ng/g dw at 5-10 cm to 6773 ng/g dw at 40-45 cm (Mean = 1665±98; Fig. 4a). The percentage LCFAs relative to TFA ranged from 12.94% at 35-40 cm to 34.72% at 0-5 cm (Mean = 23.16±7.46%) for the US (Table 5) and ranged from 4.73 at 0-5 cm to 25.54% at 45-50 cm (Mean = 13.74±7.93%) for the LS (Table 6). The higher percentage LCFA recorded for the US than the LS supported the earlier assertion of higher terrestrial OM input in the former than the later. The lower percentage of LCFAs relative to their SCFAs counterparts indicated relatively lower allochthonous input over autochthonous production in these cores.
|
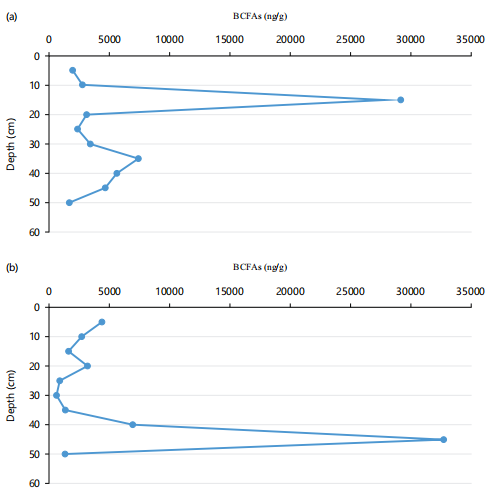
Sources: The branch-chain FAs (BCFA) concentrations for the US ranged from 1693 ng/g dw at 45-50 cm to 29169 ng/g dw at 10-15 cm (Mean = 6236±104) while those for the LS ranged from 510 ng/g dw at 25-30 cm to 28046 ng/g dw at 40-45 cm (Mean = 4789±57; Fig. 5a-b). The percentage BCFA relative to TFAs was in the range 0.65-19.42% (Mean = 11.67±5.25; Table 5) for the US and the range 16.3 to 35.2% (Mean = 25.17±5.09) with minimum/maximum at 5-10/25-30 cm and a minimum/maximum at 5-10/45-50 cm, respectively (Table 6).
Phytoplanktonic: Phytoplankton is especially the most significant source of MUFAs and Polyunsaturated FAs (PUFAs) with 20 and 22 carbon atoms25-27. The concentration of saturated FAs is less than their unsaturated counterpart in most phytoplanktons with the exception of Cyanophyceae population28.
It is known that unsaturated FAs easily undergo preferential degradation relative to their saturated counterpart9. In current study, the non-detection of PUFAs may be linked to occurrence of Cyanophyceae population at these sites and/or abiotic/biotic degradation and thus, the original amounts of PUFAs would not be preserved. Similar scenario played out in sediments from the Imo River1. The detection of relatively low levels of MUFA (C16:1) was reflective of enhanced microbial-mediated activity in the cores with higher susceptibility in LS than in US.
Tetradecanoic acid (C14:0), a diatom marker was found in relative considerable abundance with highest levels recorded in 10-15 cm and 40-45 cm for the US (26995 ng/g) and LS (21652 ng/g), indicating significant contributions of diatoms to these sediment intervals relative to other intervals. Mangrove leaf litre, sewage discharge, bacteria and plankton have been reported to be dominated by palmitic acid (C16:0) in sediments from different regions of the world10. It appears planktonic-derived OM predominated the C16:0 flux in the studied sites over other sources. This assertion is supported by the intensities of the relationships between C16:1 and C16:0 established using Pearson correlation model. The results indicated strong and good positive correlations of r = 0.9704 and r = 0.5638 for the US and LS, respectively. The implication here was that these FAs were derived more from the same source (e.g., phytoplankton) in the US than in the LS.
|
Fang et al.8 and El-Karim et al.9 proposed that a phytoplankton source in aquatic sediments may also be determined by way of the ratio:sum of all FAs having 16 carbon atoms to the sum of all FAs having 18 carbon atoms (ΣC16:0/ΣC18:0). According to these authors, increased values of the ratio represent the increased proportion of phytoplankton. In the study, ΣC16:0/ΣC18:0 for all samples were>1. The results did not only reflect a significant contribution from phytoplankton to these sites but also indicated maximization of these organisms at 10-15 cm and 40-45 cm in the US and LS, respectively (Table 5 and 6). Other FAs based proxies such as C16:1/C16:0 have been used to distinguish between phytoplankton taxonomic classes such as diatom and dinoflagellate29. It was documented that the ratio higher than 1.6 has been interpreted as indicating a predominance of diatoms9. However, C16:1/C16:0 ratios were <1 in the two cores, indicating a lesser abundance of diatoms relative to other algal-derived OM such as dinoflagellates in both cores.
Gong and Hollander30 reported that nC16:0 and nC18:0 prevailed under anoxic conditions, whereas nC22:0 and nC24:0 prevailed under oxic conditions. Therefore, on this basis, it is most likely that the depositional environment in the present study was thought to be more anoxic, particularly in the US than at the LS due to a higher abundance of nC16:0 and nC18:0 in the former than in the latter.
Terrestrial: In many aquatic environments, there is a concerted effort to evaluating the expanse of contribution from terrestrial plants to OM fluxes. Even numbered, saturated long-chain FAs>C24 in aquatic sediments are commonly linked to OM input from higher plants indicating allochthonous sources1,27.
In open aquatic environments, transmission by wind is more important than those from run-off for terrestrial OM10. Bourbonniere et al.31 once used terrestrial aquatic ratio for FA (TARFA) to determine the proportions of terrestrial and aquatic inputs in TFAs, expressed specifically as:
The TARFA distributions for the US ranged from 0.11 at 35-40 cm to 0.61 at 0-5 cm (Mean = 0.36±0.17) and from 0.03 at 0-5 cm and 5-10 cm to 0.32 at 45-50 cm (Mean = 0.12±0.10) for the LS (Table 5 and 6). The generally low TARFA values recorded supported a relatively lower proportion of terrestrial OM inputs than aquatic production at the two sites. Also, the observed higher TARFA values recorded for the US relative to LS supported the earlier suggestion of higher input of terrestrial OM to the former than the latter, most likely due to the proximity of the former to shoreline. The fact that TARFA peaked at the top layer of the US and the bottom of the LS highlighted the relative importance of resistance of terrestrial OM to biodegradation in the former and physical mixing during tidal excursions and storms in the latter.
Fairly good correlation existed between ΣC24+C26 +C28 (terrestrial markers) and TOC for the US (r = 0.4549) and LS (r = 0.3778), indicating moderate contribution of terrestrial FAs to the sedimentary carbon. The strong correlation that existed between ΣC24+C26+C28 and phytol (a diagenetic product of chlorophyll-a that occurs mainly in higher plant and phytoplankton) for the US (r = 0.8810) relative to the LS (r = 0.094) revealed greater contribution of terrestrial plant to chlorophyll-a over phytoplankton in the US than in the LS. It also supported the earlier assertion of higher input of terrestrial OM to the US than the LS.
Bacterial: Bacteria are typical autochthonous sources of odd and branched chain FAs especially the iso- and anteiso-acids, Ci13:0, Ci14:0, Ci15:0, Ca15:0, Ci16:0 and Ci17:0 as reported by several researchers24,27,32. Other FAs reported to be produced by gram positive aerobic and anaerobic bacteria are C15:0 and C17:010. An increasing number of studies indicate that i/a15:0 and i/a17:0 are derived from sulphate-reducing bacteria in aquatic sediments and are isolated from Desulfovibrio, Desulfobacter and Desulfobulbus32. In the study, the high values of i/a15:0 (>1) were found for the US with a maximum at 30-35 cm, supporting the predominant anoxic condition of the US sediment that allowed sulfur-reducing bacteria to thrive except at 45-50 cm sediment interval which exhibited an oxic condition. In the case of the LS, the values of i/a15:0 were mainly <1 indicating a higher population of aerobic bacteria thrived in an oxic sediment of the lower estuary except at 0-5 cm and 5-10 cm where sulphate reducing bacteria thrived (Table 5 and 6). It appears bioirrigation and sediment reworking by benthic macrofauna continuously introduce fresh OM and electron acceptor (sulphur reducing bacteria) into the upper layers of the lower system sediment. The transition from anoxic zone (top layers) to oxic zone (underlying middle to bottom layers) of LS represented an ecological transition in the sediment core that influenced the population of bacteria10. The significant contribution of bacterial FAs suggested the operation of effective microbial activity and various biogeochemical processes occurring at these sites.
The lower percentage of BCFA found in the anoxic US core relative to the predominantly oxic LS was not consistent with Gong and Hollander30 finding who reported a higher contribution of BCFAs in sediments from anoxic depocenter than in oxic sediments from the periphery of the Santa Monica basin. The fact that slightly lower positive correlations existed between BCFA and TOC for the US (r = 0.393) and LS (r = 0.342) relative to the correlation coefficients of TFA versus TOC for the corresponding cores indicated significant bacterial contributions to the sedimentary organic carbon compared to other OM sources. Therefore, this relationship stimulated microbial metabolism, sediment oxygen demand and nutrient regeneration within the two cores10. The positive correlation of phytol with BCFA for US (r = 0.2042) and LS (r = 0.3933) showed the efficacy of algal OM as the main substrate for the bacterial community. From the results of bacterial FAs, it can be inferred that bacterial recycling played an active role in the OM transformation of the study site. The moderate and weak positive correlation existed between phytol and TN for the US (r = 0.397) and LS (r = 0.1237), respectively, supporting the earlier assertion that population of aerobic non-photosynthetic bacteria that degrade OM was higher in the LS than in the US.
Source and fate characterization by principal component analysis and multiple linear regression: The use of the molecular indices may be associated with bias or deviations, therefore the simultaneous use of Principal Component Analysis (PCA) and multiple linear regression (MLR) was to properly identify and quantify FAs sources and fate for future judgment and modelling.
Principal Component Analysis (PCA): The large number of FAs detected in the two cores demands a statistical model to successfully deal with the independent effects on their source identification and apportionment. Chemometrics was employed for the FAs, which permits reduction of the data and can give a more reliable interpretation of the results. The potential sources of FAs in the US and LS were further uncovered via Varimax rotated PCA with Kaiser Normalization.
In the US, two principal components (PC1 and PC2) were identified based on eigenvalue >1 which accounted for 93.90% of total variance (Table 7). The first component PC1 accounting for 87.12% of total variability was heavily weighted by short and mid-chain FAs including C12, C13, Ci13, Ci14, C15, Ci15, Ca15, C16, C21 and C22 as well as long-chain type such as C24, C25, C26, C27 and C28 that are, respectively markers for phytoplankton (e.g., dinoflagellate), non-photosynthetic or heterotrophic bacteria (eg. Desulfovibrio desulfuricans, Bacillus subtilis, Bacillus insolitus, Agrobacterium, Xanthomonas) and terrestrial higher plant (e.g., mangrove litre-Rhizophora avicennia) contributions9,14. Therefore, PC1 was assigned a mixed source of phytoplankton and non-photosynthetic bacteria as well as terrestrial higher plant and its metabolites and explained the active diagenesis of phytoplankton/higher plant derived OM by non-photosynthetic bacterial community. The second component (PC2) accounted for 6.78% of total variance and was highly loaded with other short- and mid-chain FAs such as C14, C18, Ca16, C17, C19, C20 and C23 (Table 7) that were attributed to a different consortium of phytoplanktons (e.g., diatom)26 and photosynthetic bacteria (e.g., Oscillatoria, Spirulina and Microcystis)9. Therefore, PC2 was also assigned a mixed aquatic source of diatom and photosynthetic bacteria and explained the active diagenesis of diatom by photosynthetic bacterial community.
In the case of LS, two principal components were also identified (PC1 and PC2) accounting for 91.20% of total variability (Table 8). The first component (PC1) accounted for 84.78% of total variance and was heavily weighted by short- and mid-chain FAs including C12, C13, Ci13, C15, Ci15, Ca15, C16, C17, C20, C22 and C23 as well as long-chain FAs such as C24, C26 and C28 (Table 8) that are respective characteristics of phytoplankton (e.g., dinoflagellates) and non-photosynthetic or heterotrophic bacteria (e.g., Desulfovibrio desulfuricans, Bacillus subtilis, Bacillus insolitus, Agrobacterium and Xanthomonas) as well as a terrestrial plant (e.g., mangrove litre-Nypa fruticans, Rhizophora apiculata) contributions9,14. Therefore, PC1 was assigned a mixed source of phytoplankton (e.g., dinoflagellate), non-photosynthetic bacteria and terrestrial plants (e.g., Nypa fruticans) and explained the active diagenesis of phytoplankton/terrestrial plant by non-photosynthetic bacterial community. The second component (PC2) contributed 6.42% to the total variance and was heavily loaded with short- and long-chain FAs such as C14, Ci16, Ca16 and C19 as well as C25 and C27 (Table 8) that are markers for photosynthetic bacteria (e.g., Oscillatoria, Spirulina, Microcystis)9 and metabolic products of terrestrial plant that are located exclusively in the mangrove ecosystem due to an affinity with wet, muddy, silty and saline sediments), respectively. Accordingly, PC2 was therefore attributed to a mixed source of terrestrial plant metabolite and photosynthetic bacteria that explained the active diagenesis of terrestrial plants by photosynthetic bacteria community.
| Table 7: | Varimax rotated component matrix of fatty acids for us core | |||
| Components | ||
| Fatty acid | 1 | 2 |
| C12 | 0.754 | 0.383 |
| C13 | 0.813 | 0.579 |
| Ci13 | 0.749 | 0.627 |
| C14 | 0.557 | 0.816 |
| Ci14 | 0.782 | 0.606 |
| C15 | 0.895 | 0.44 |
| Ci15 | 0.888 | 0.424 |
| Ca15 | 0.904 | 0.399 |
| C16 | 0.785 | 0.616 |
| Ci16 | 0.353 | 0.929 |
| C16a | 0.418 | 0.904 |
| C17 | 0.752 | 0.657 |
| C18 | 0.45 | 0.463 |
| C19 | 0.937 | 0.11 |
| C20 | 0.566 | 0.761 |
| C21 | 0.917 | 0.383 |
| C22 | 0.888 | 0.452 |
| C23 | 0.206 | 0.972 |
| C24 | 0.841 | 0.522 |
| C25 | 0.814 | 0.569 |
| C26 | 0.817 | 0.561 |
| C27 | 0.779 | 0.602 |
| C28 | 0.833 | 0.534 |
| Eigenvalues | 20.039 | 1.56 |
| Variance (%) | 87.124 | 6.784 |
| Source | Mixed-dinoflagellate, heterotrophic bacteria and terrestrial plants |
Mixed-diatoms and photosynthetic bacteria |
| Table 8: | Varimax rotated component matrix of fatty acids for LS core | |||
| Components | ||
| Fatty acids | 1 | 2 |
| C12 | 0.916 | 0.394 |
| C13 | 0.944 | 0.327 |
| Ci13 | 0.909 | 0.402 |
| C14 | 0.593 | 0.331 |
| Ci14 | 0.935 | 0.344 |
| C15 | 0.947 | 0.315 |
| Ci15 | 0.942 | 0.327 |
| Ca15 | 0.913 | 0.399 |
| C16 | 0.439 | 0.897 |
| Ci16 | 0.409 | 0.909 |
| Ca16 | 0.577 | 0.945 |
| C17 | 0.705 | 0.649 |
| C18 | 0.575 | 0.788 |
| C19 | 0.431 | 0.959 |
| C20 | 0.751 | 0.619 |
| C21 | 0.793 | 0.468 |
| C22 | 0.877 | 0.466 |
| C23 | 0.824 | 0.52 |
| C24 | 0.902 | 0.39 |
| C25 | 0.688 | 0.716 |
| C26 | 0.825 | 0.512 |
| C27 | 0.65 | 0.735 |
| C28 | 0.881 | 0.388 |
| Initial eigenvalues | 19.5 | 1.477 |
| Variance (%) | 84.783 | 6.421 |
| Source | Mixed-dinoflagellate, heterotrophic bacteria and terrestrial plants |
Mixed-photosynthetic bacteria and terrestrial plants metabolites |
|
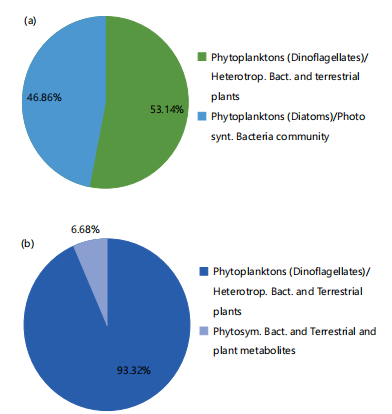
Multiple linear regression: Multiple linear regression (MLR) was applied to quantify the contributions of different FA sources to the US and LS cores. In the US, phytoplankton (e.g., dinoflagellate), non-photosynthetic or heterotrophic bacteria and terrestrial plants made the larger contribution of 53.14%, while a different species of phytoplankton (e.g., diatom) and photosynthetic bacteria community contributed 46.86% to the total FAs flux (Fig. 6a). In the case of LS, phytoplankton (e.g., dinoflagellate), non-photosynthetic or heterotrophic bacteria and terrestrial plants made the larger contributions of 93.32%, while photosynthetic bacteria and terrestrial plant metabolites made a contribution of 6.68% to the total FAs flux (Fig. 6b).
CONCLUSION
The study is the first report on the fate, sources and distribution of fatty acid biomarkers in recent sediment cores of the Upper and Lower Cross River system. The non-detection of polyunsaturated fatty acids may be linked to occurrence of high abundance of Cyanophyceae population and/or abiotic/biotic degradation.
Terrestrial (e.g., mangrove litter addition-Rhizophora avicennia) and phytoplanktonic (e.g., diatoms/ dinoflagellate production) organic matter most likely underwent active diagenesis predominantly by anaerobic bacteria in the US, while mainly aerobic bacteria were active in the degradation of a terrestrial plant (e.g., mangrove litre addition-Nypa fruticans) and phytoplankton (diatom/dinoflagellate) in the LS, regenerating useful nutrients for the growth of aquatic flora and fauna. The contribution of allochthonous organic matter was lower in the LS than in the US, whereas the reverse was the case for autochthonous production.
A significant proportion of fatty acids were derived from bacterial sources, indicating the functioning of an effective microbial activity in this system. The values of Ci15:0/Ca15:0 for the US and LS suggested the sulfide and sulphate formation pathways occurred predominantly at these two sites, respectively. Thus, the biomarkers of anaerobic non-photosynthetic bacteria such as Desulfobulbus type and/or sulfur-reducing bacteria thrived more in the US, while aerobic/anaerobic photosynthetic bacteria such as Oscillatoria and/or sulfur-oxidizing bacteria were the dominant species in the LS, reflecting the different biogeochemical processes occurring at these sites.
The variations in water depth, biotic/abiotic degradation, redox potential, sediment texture, proximity to point source, primary production and sedimentation rate associated with physical mixing during tidal excursions and storms were the factors that determined the distribution of fatty acids at these sites. Principal component analysis coupled with a multiple linear regression approach revealed similar source type inputs to the two sites with a remarkable difference in their source contributions.
SIGNIFICANCE STATEMENT
The purpose of the study was to demonstrate the efficacy of fatty acids as indicators of organic matter sources and biogeochemical processes within the Cross River drainage system with the view of reconstructing past environmental conditions. Findings revealed the effects of differences in environmental conditions between the river and estuarine sediment cores on the distribution and fate of fatty acids for the first time in the System. Quantification of the fatty acid sources in the study could help in the future estimation of global carbon cycle.
ACKNOWLEDGMENT
We are thankful to the Management of State Key Laboratory of Marine Geology, School of Ocean and Earth Science, Tongji University, Shanghai, China for the running of our fractions by Gas Chromatography-Mass Spectrometry (GC-MS) at subsided rate.
REFERENCES
- Oyo-Ita, O.E. and I.O. Oyo-Ita, 2012. Fatty acid and alcohol distributions and sources in surface sediments of Imo River, Southeast Niger Delta, Nigeria. Environ. Nat. Resour. Res., 2: 101-113.
- Blyth, A.J., A. Hartland and A. Baker, 2016. Organic proxies in speleothems-New developments, advantages and limitations. Quat. Sci. Rev., 149: 1-17.
- Kalpana, M.S., J. Routh, S. Fietz, M.A. Lone and A. Mangini, 2021. Sources, distribution and paleoenvironmental application of fatty acids in speleothem deposits from Krem Mawmluh, Northeast India. Front. Earth Sci., 9.
- Zhang, K., X. Dong, X. Yang, G. Kattel, Y. Zhao and R. Wang, 2018. Ecological shift and resilience in China's lake systems during the last two centuries. Global Planet. Change, 165: 147-159.
- Wakeham, S.G. and J.A. Beier, 1991. Fatty acid and sterol biomarkers as indicators of particulate matter source and alteration processes in the Black Sea. Deep Sea Res. Part A. Oceanogr. Res. Pap., 38: S943-S968.
- Li, X., C. Wang, J. Huang, C. Hu and S. Xie, 2011. Seasonal variation of fatty acids from drip water in Heshang Cave, Central China. Appl. Geochem., 26: 341-347.
- Ouyang, X., F. Guo and H. Bu, 2015. Lipid biomarkers and pertinent indices from aquatic environment record paleoclimate and paleoenvironment changes. Quat. Sci. Rev., 123: 180-192.
- Fang, J., F. Wu, Y. Xiong, F. Li, X. Du, D. An and L. Wang, 2014. Source characterization of sedimentary organic matter using molecular and stable carbon isotopic composition of n-alkanes and fatty acids in sediment core from Lake Dianchi, China. Sci. Total Environ., 473: 410-421.
- El-Karim, M.S.A., A.M.A. Mahmoud and M.H.H. Ali, 2016. Fatty acids composition and sources of organic matter in surface sediments of four river nile sub-branches, Egypt. J. Fish. Aquatic Sci., 11: 216-224.
- Resmi, P., T.R. Gireeshkumar, C.S.R. Kumar, P.B. Udayakrishnan and N. Chandramohanakumar, 2023. Distribution and sources of fatty acids in surface sediments of mangrove ecosystems in the Northern Kerala Coast, India. Environ. Forensics, 24: 183-196.
- Pisani, O., D.R. Oros, O.E. Oyo-Ita, B.O. Ekpo, R. Jaffé and B.R.T. Simoneit, 2013. Biomarkers in surface sediments from the Cross River and estuary system, SE Nigeria: Assessment of organic matter sources of natural and anthropogenic origins. Appl. Geochem., 31: 239-250.
- Strauss, J., L. Schirrmeister, K. Mangelsdorf, L. Eichhorn, S. Wetterich and U. Herzschuh, 2015. Organic-matter quality of deep permafrost carbon-A study from Arctic Siberia. Biogeosciences, 12: 2227-2245.
- Russell, J.M. and J.P. Werne, 2007. The use of solid phase extraction columns in fatty acid purification. Org. Geochem., 38: 48-51.
- Oyo-Ita, O.E., J.O. Offem, B.O. Ekpo and P.A. Adie, 2013. Anthropogenic PAHs in mangrove sediments of the Calabar River, SE Niger Delta, Nigeria. Appl. Geochem., 28: 212-219.
- Oyo-Ita, I.O., E.S. Sam, O.E. Oyo-Ita, E.T. Arnold, D.O. Inyang and J.P. Werne, 2023. Stable carbon isotope and n-alkane distributions in sediment cores from saline and freshwater Gabu Lakes, Southeast Nigeria: Environmental implications. Environ. Earth Sci., 82.
- Ünlü, S. and B. Alpar, 2006. Distribution and sources of hydrocarbons in surface sediments of Gemlik Bay (Marmara Sea, Turkey). Chemosphere, 64: 764-777.
- Ak, A.T.A., H.T. Al-Saad, A.A. Douabul, M. Salah and A.A. Hantoosh, 2015. Distribution and sources of fatty acids in sediment samples from Shatt Al-Arab Estuary and Northwest Arabian Gulf. Int. J. Mar. Sci., 5: 1-6.
- Camacho-Ibar, V.F., L. Aveytua-Alcázar and J.D. Carriquiry, 2003. Fatty acid reactivities in sediment cores from the northern Gulf of California. Org. Geochem., 34: 425-439.
- Meyers, P.A., 1997. Organic geochemical proxies of paleoceanographic, paleolimnologic and paleoclimatic processes. Org. Geochem., 27: 213-250.
- González-Vila, F.J., O. Polvillo, T. Boski, D. Moura and J.R. de Andrés, 2003. Biomarker patterns in a time-resolved holocene/terminal Pleistocene sedimentary sequence from the Guadiana River Estuarine Area (SW Portugal/Spain border). Org. Geochem., 34: 1601-1613.
- Dan, S.F., S.M. Liu, B. Yang, E.C. Udoh, U. Umoh and I. Ewa-Oboho, 2019. Geochemical discrimination of bulk organic matter in surface sediments of the Cross River estuary system and adjacent shelf, South East Nigeria (West Africa). Sci. Total Environ., 678: 351-368.
- Rushdi, A.I., A.A. DouAbul, S.S. Mohammed and B.R. Simoneit, 2006. Compositions and sources of extractable organic matter in Mesopotamian marshland surface sediments of Iraq: II. Polar compounds. Environ. Geol., 50: 1171-1181.
- Mao, S., X. Zhu, Y. Sun, H. Guan, D. Wu and N. Wu, 2015. Source and implication of fatty acids in surface sediments from the Pearl River Mouth Basin, South China Sea. Indian J. Geo-Mar. Sci., 44: 1528-1539.
- Hu, J., H. Zhang and P.A. Peng, 2006. Fatty acid composition of surface sediments in the subtropical Pearl River estuary and adjacent shelf, Southern China. Estuarine Coastal Shelf Sci., 66: 346-356.
- Wakeham, S.G., 1999. Monocarboxylic, dicarboxylic and hydroxy acids released by sequential treatments of suspended particles and sediments of the Black Sea. Org. Geochem., 30: 1059-1074.
- Waterson, E.J. and E.A. Canuel, 2008. Sources of sedimentary organic matter in the Mississippi River and adjacent Gulf of Mexico as revealed by lipid biomarker and δ13CTOC analyses. Org. Geochem., 39: 422-439.
- Liu, H. and W. Liu, 2017. Concentration and distributions of fatty acids in algae, submerged plants and terrestrial plants from the Northeastern Tibetan Plateau. Org. Geochem., 113: 17-26.
- Lautier, J., A. Maleville, H. Cousse, G. Mouzin and J. Lagarrigue, 1993. Variations in fatty acid composition of phytoplanktonic production in sewage treatment ponds at meze. Effects on the valorization of microalgal biomass. Comp. Biochem. Physiol. Part B: Comp. Biochem., 104: 769-773.
- Ramos, C.S., C.C. Parrish, T.A.O. Quibuyen and T.A. Abrajano, 2003. Molecular and carbon isotopic variations in lipids in rapidly settling particles during a spring phytoplankton bloom. Org. Geochem., 34: 195-207.
- Gong, C. and D.J. Hollander, 1997. Differential contribution of bacteria to sedimentary organic matter in oxic and anoxic environments, Santa Monica Basin, California. Org. Geochem., 26: 545-563.
- Bourbonniere, R.A., S.L. Telford, L.A. Ziolkowski, J. Lee, M.S. Evans and P.A. Meyers, 1997. Biogeochemical Marker Profiles in Cores of Dated Sediments from Large North American Lakes. In: Molecular Markers in Environmental Geochemistry, Eganhouse, R.P. (Ed.), American Chemical Society, Washington, DC, United States, ISBN: 9780841235182, pp: 133-150.
- Kaneda, T., 1991. Iso-and anteiso-fatty acids in bacteria: Biosynthesis, function, and taxonomic significance. Microbiol. Rev., 55: 288-302.
How to Cite this paper?
APA-7 Style
Oyo-Ita,
I.O., Ekpo,
I.O., Umoh,
U.U., Oyo-Ita,
O.E. (2024). Geochemical Characterization of the Sources and Distribution of Fatty Acids in Recent Sediment Cores from Cross River System, South-South, Nigeria. Trends in Applied Sciences Research, 19(1), 126-144. https://doi.org/10.3923/tasr.2024.126.144
ACS Style
Oyo-Ita,
I.O.; Ekpo,
I.O.; Umoh,
U.U.; Oyo-Ita,
O.E. Geochemical Characterization of the Sources and Distribution of Fatty Acids in Recent Sediment Cores from Cross River System, South-South, Nigeria. Trends Appl. Sci. Res 2024, 19, 126-144. https://doi.org/10.3923/tasr.2024.126.144
AMA Style
Oyo-Ita
IO, Ekpo
IO, Umoh
UU, Oyo-Ita
OE. Geochemical Characterization of the Sources and Distribution of Fatty Acids in Recent Sediment Cores from Cross River System, South-South, Nigeria. Trends in Applied Sciences Research. 2024; 19(1): 126-144. https://doi.org/10.3923/tasr.2024.126.144
Chicago/Turabian Style
Oyo-Ita, Inyang, Okon, Ikip Ofem Ekpo, Unyime Umoh Umoh, and Orok Esu Oyo-Ita.
2024. "Geochemical Characterization of the Sources and Distribution of Fatty Acids in Recent Sediment Cores from Cross River System, South-South, Nigeria" Trends in Applied Sciences Research 19, no. 1: 126-144. https://doi.org/10.3923/tasr.2024.126.144

This work is licensed under a Creative Commons Attribution 4.0 International License.