Assessment of Physicochemical Properties and Mineral Composition of Fresh Raw Cow Milk in Hawassa City, Sidama Region, Ethiopia
-
Giro Ashenafi Lorenso
Tesso Secondary School, Hawassa, Sidama Regional State, Ethiopia
Haile Melaku Zigde

Chemistry Department, College of Natural and Computational Science, Hawassa University, Hawassa, Ethiopia
| Received 18 Oct, 2025 |
Accepted 11 Dec, 2025 |
Published 31 Dec, 2025 |
Background and Objective: Milk is a highly nutritious food; however, its quality must meet established standards to ensure consumer safety and nutritional adequacy. This study evaluated the physicochemical properties and metal content of raw cow’s milk sold in informal markets in Hawassa City, Sidama Region, Ethiopia, to determine its compliance with quality standards. Materials and Methods: Raw cow’s milk samples were collected from informal markets and analyzed at Hawassa University. Fat, solids-non-fat (SNF), milk density (CLR) and added water were determined using an EKOMILK Ultrasonic Milk Analyzer, while total moisture and ash contents were analyzed by the Gravimetric Method. Total protein, total solids and lactose were calculated from SNF values. Metal concentrations (Ca, Mg, Cu, Mn, Ni, Co, Cr, Pb) were determined by flame atomic absorption spectrometry (FAAS). Data were analyzed using One-way ANOVA to assess variations among samples at a significance level of p<0.05. Results: The measured quality parameters ranged as follows: pH (6.59-6.73), added water (5.54-10.33%), density (1.0227-1.0287 g/mL), titratable acidity (0.153-0.213%), total solids (10.57-13.80%), total ash (0.603-0.636%), SNF (7.27-7.67%), total fat (3.27-6.23%), total protein (2.67-2.81%) and lactose (3.99-4.22%). Metal concentrations were Ca (1124.77-1505.11 mg/L), Mg (102.33-109.00 mg/L), Cu (0.0536-0.0817 mg/L) and Mn (0.052-0.0716 mg/L), while Ni, Co, Cr and Pb were below detection limits. Recovery rates for spiked samples ranged from 99.8 to 104.2%. The ANOVA revealed significant differences (p<0.05) among most parameters except total ash, SNF, total protein and lactose. Conclusion: Most milk samples met Ethiopian and EU standards for pH, density, acidity, ash and lactose but were below recommended limits for total fat, protein and SNF. Milk sold in informal markets of Hawassa is thus considered low in key nutritional components, highlighting the need for improved quality monitoring and regulation.
| Copyright © 2025 Lorenso and Zigde. This is an open-access article distributed under the Creative Commons Attribution License, which permits unrestricted use, distribution, and reproduction in any medium, provided the original work is properly cited. |
INTRODUCTION
Milk producers in Hawassa City, Sidama Region, Ethiopia use flour, oil and fruit industry byproducts and crop residues to feed their livestock in addition to keeping their livestock out to graze in the field. Such livestock feeding style might have an effect in the physicochemical properties and metal content of raw whole cow’s milk produced and sold to the consumers. Moreover, the consumers in Hawassa City buy raw whole cow’s milk from informal markets that do not employ mandatory milk quality standards. Thus, this study provides insights into the quality of raw whole cow’s milk sold out in informal market in Hawassa, Ethiopia.
Milk is a wholesome food as it contains various nutrients that are essential for growth, bone development and immune function1. Milk is composed of calcium, potassium, phosphorus, vitamin D, vitamin A, vitamin B-12, riboflavin, niacin and proteins2. Milk is also containing a small amount of magnesium, zinc, iron and copper which are essential to the body3.
Study showed that the composition of milk is affected by genetics, physical and environmental factors such as seasonal changes and weather4. However, milk composition is also varied due poor handling, processing and storage and the practice of adulteration5. Hence, milk is a food that can easily be perishable5 and prone to adulteration. Milk adulteration practices include addition of drinkable water or whey, skim milk powder, salt, detergent, sugar cane, urea, coloring agents, starch and acids for various purposes throughout the supply chains6,7. Thus, this study aimed to assess the physicochemical quality and mineral composition of raw whole cow’s milk sold in informal markets in Hawassa City to ensure the milk quality meets national and international standards and to help milk producers improve the quality and safety of their products and to provide a base for further research regarding milk production, safety and quality.
MATERIALS AND METHODS
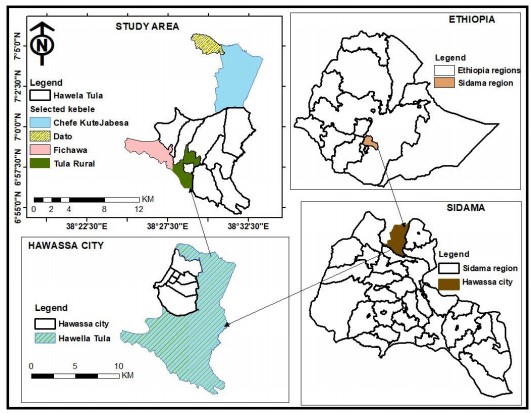
Description of the study area: The study was conducted in Hawassa city, Sidama Regional State (Fig. 1). Hawassa, the regional capital of Sidama, Regional State, is 275 km South of Addis Ababa capital city of Ethiopia.
|
Sampling and sample collection: Tula sub-city has the highest milk production in the city. The selected sub-city was the Tula sub-city which has twelve kebeles. Out of twelve kebeles, four kebeles (Dato, Chefekotijebesa, Finchawa and Tula Geter) were selected purposefully as these kebeles were the major milk-producing kebeles in Tula sub-city, which have at least 60-70 milking cows. Then, from each kebele, one commercial dairy farm was selected randomly and the raw whole milk sample was purchased from their milk-selling shops. A total of 2.0 L of raw whole cow milk were purchased during August 2025, kept in a cooled box with an icepack before it was transported to the Hawassa University laboratory and chilled at 4°C before immediate analysis. The determination of fat, solids-non-fat (SNF), milk density (CLR) and added water to milk were carried out using the EKOMILK Ultrasonic Milk Analyzer, in Hawassa University Dairy processing plant. The rest of the physicochemical parameters were determined in the Chemistry laboratory, Hawassa University.
Sample preparation for mineral analysis: Mineral analysis of a milk sample involves the dissolution of the milk components to release the minerals present in the milk. In this study, an open acid digestion using Nitric Acid (HNO3), 65% (w/v) supra-pure (Merck) and Hydrogen Peroxide (H2O2), 30% (w/v) was used8. The digestion of raw whole cow milk samples was carried out after optimization of the digestion procedures. Based on the optimized digestion conditions (i.e., 8.0 mL HNO3 (70%): 4.0 mL H2O2 (30%), 180°C digestion temperature and 1:30 hrs digestion time), 5.0 mL of the raw cow’s milk sample was transferred into a Kjeldahl digestion apparatus fitted with a reflux condenser and digested for about 1:30 hrs. Then, the digest was allowed to cool to room temperature for about 20 min and 10 mL of distilled water was added to dissolve the precipitate8. Then, the solution was filtered in a 100 mL volumetric flask and distilled water was added up to the mark. The milk sample digestions were carried out in triplicate.
Analysis of the physicochemical quality of milk: The determination of fat, solids-non-fat (SNF), milk density (CLR) and added water to milk was carried out using the EKOMILK Ultrasonic Milk Analyzer in Hawassa University. Subsequently, total solids content, lactose content and total protein content were determined by using the following formulae:
Determination of pH: A portable pH meter (PH-013M) was used to measure the pH of raw whole cow milk samples after the pH meter was calibrated with standard buffer solutions pH = 4.0 and pH = 7.09. Then, 50 mL of raw whole cow milk sample was placed in a beaker and the sensor electrode of the pH meter (pH electrode) was immersed into the beaker and pH was read out. The sensor of the electrode of the pH meter was cleaned with distilled water between measuring the different raw whole cow milk samples.
Determination of titratable acidity: Titratable acidity was determined by taking a 10 mL raw whole cow milk sample in a 100 mL conical flask, 5 drops of 1% phenolphthalein indicator solution were added to it and the solution was diluted with 10 mL of distilled water10. The mixture was then titrated with 0.1N NaOH solution until a faint pink color appeared. The volume of NaOH consumed during the titration was recorded and used to calculate the Titratable acidity (%). Titratable acidity of the raw whole cow milk samples was expressed as percent lactic acid9 as follows:
Determination of total ash: Determination of ash content (mineral content) in a raw whole cow milk sample was done using the Gravimetric Method11. In this method, the milk samples were dried in an oven and the dried milk samples were weighed and ignited in a muffle furnace at a temperature of 550°C for 3:00 hrs, which made the dried milk samples burn to ashes. The ash was cooled in desiccators and then their weight was determined. The percentage ash content was calculated as follows:
Determination of minerals: The mineral contents of the raw whole cow milk samples were determined by atomic absorption spectrometry12. The digested milk samples were aspirated, aerolized and mixed with combustible gases such as acetylene and air and burned in a flame to release the individual atoms12. These atoms absorb ultraviolet light emitted from the hollow cathode lamp at a wavelength specific to the atoms and they are excited to higher energy levels. This reduces the intensity of the incoming ultraviolet light. Thus, the instrument measures the change in intensity and the computer data system converts the change in intensity into an absorbance and subsequently to concentration units12. The concentrations of elements recorded were in terms of ppm.
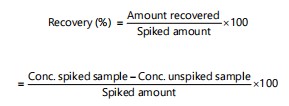
Recovery test: A spiking experiment was done to check the accuracy of the digestion procedure and the atomic absorption spectrophotometer as there were no certified milk standards. In this experiment, one sample was selected (5.0 mL of raw whole cow milk sample), spiked with 50 μL of 1000 mg/L of Ca, Mg, Cu and Mn standard solutions at once and digested following the same digestion procedure used for unspiked raw cow’s milk samples. The spiked samples were digested in triplicate and analyzed for the respective metals. The %recovery for each metal was calculated using the following formula13:
 |
Data analysis: Descriptive statistics were used to summarize the values of the physicochemical parameters and metal content of the honey samples. One-way Analysis of Variance (ANOVA) tests were used to distinguish whether the differences among milk samples were significant at a significance level of p<0.05. The analysis was performed using IBM SPSS 20 statistical software.
RESULTS AND DISCUSSION
Results of the physicochemical analysis of milk samples: Table 1 shows the physicochemical quality of raw cow milk samples collected from four sampling sites in the study area.
pH: pH is a physicochemical property that indicates the bitterness or sourness of milk and their products. The average pH value of raw cow milk samples ranged from 6.59 to 6.73 as given in Table 1. The highest mean value (6.73) of pH was recorded in sample 1, while the least mean value (6.59) of pH was recorded in sample 3. One-way ANOVA analysis showed that the pH content was significantly different, F (3, 8) = 36.377, p<0.001, among the four raw cow milk samples. However, post hoc test revealed the pH value of sample 2, 3 and 4 were not statistically significantly different. According to the Ethiopian Standard for raw whole cow milk specification14, the pH of raw whole cow milk ranges from 6.6 to 6.8 and the results showed that the mean pH value of all raw cow milk samples was within the ES pH range indicating that the milk samples were collected shortly after milking. Lower pH value (6.6) indicates the prevalence of bacteria growth and multiplication and above 6.8 indicating udder infection (mastitis)14. The present results were higher pH value than reported by Gemetchu et al.10 in milk from farms, cooperative and market 6.39, 6.32 and 6.195, respectivelyand a study conducted in milk shades around Addis Ababa, Ethiopia14. These might be due to poor milk handling and storing practices.
| Table 1: | Physicochemical analysis results (Mean±SD, n = 3, %) of raw cow milk samples | |||
| Parameter | Sample 1 | Sample 2 | Sample 3 | Sample 4 |
| pH | 6.73±0.02 | 6.62±0.02 | 6.59±0.01 | 6.63±0.03 |
| Water added (%) | 10.33±0.31 | 5.54±0.31 | 6.37±0. 015 | 6.09±0.10 |
| Density (g/mL) | 1.023±0.001 | 1.027±0.001 | 1.024±0.003 | 1.029±0.001 |
| Titratable acidity (% lactic acid) | 0.153±0.006 | 0.186±0.006 | 0.213±0.006 | 0.166±0.006 |
| Moisture (%) | 86.2±0.1 | 88.03±0.15 | 89.43±0.55 | 89.27±0.06 |
| Total solids (%) | 13.80±0.10 | 11.97±0.15 | 10.57±0.55 | 10.73±0.06 |
| Total ash (%) | 0.628±0.021 | 0.636±0.017 | 0.603±0.042 | 0.620±0.013 |
| Solid-not-fat (%) | 7.57±0.25 | 7.67±0.21 | 7.27±0.50 | 7.47±0.15 |
| Total fat (%) | 6.23±0.1527 | 4.17±0.15 | 3.30±0.10 | 3.27±0.12 |
| Total protein (%) | 2.78±0.09 | 2.81±0. 08 | 2.67±0.18 | 2.74±0.06 |
| Lactose (%) | 4.16±0.14 | 4.22±0.11 | 4.00±0.28 | 4.11±0.08 |
Water added (%): The average water added (only added water) content of raw cow milk samples analyzed were varied from 5.54%to 10.33%. The highest water added value was in sample 1 and the lowest value was in sample 2 (Table 1). One-way ANOVA analysis showed that there was a significant difference among the four raw cow milk samples on the values of water added (%), F (3, 8) = 284.895, p<0.001. Post hoc test revealed the water added (%) in sample 1 was significantly different from the other three samples. However, the water added in sample 2 and sample 4 and sample 3 and sample 4 were not significantly different. The present study showed that all raw cow milk samples were diluted with water and the results were higher than Sebho and Meskel15 who reported overall mean value of added water in milk producers (S1) and cafeteria (S2) samples in Hossana city of Hadiya zone were sample S2 (2.30%) and sample S1 (1.08%), respectively. A similar study conducted in three regions of Ethiopia found that water adulteration was prevalent along the value chains, with rates ranging from 1.82 to 10.4%16. Additionally, a study conducted in Selale and around Addis Ababa City reported that Milk samples were adulterated with water up to 33.9%17. Generally, water adulteration of milk (addition of water to milk) is done to increase the volume of milk and to make it less expensive or to gain double profits18. However, consuming milk that has been diluted with water can reduce its nutritional value and increase the risk of food poisoning through the introduction of various disease causing microorganisms, harmful chemicals and poisonous substances and become a health risk to the consumer15,16,18.
Density (g/mL): The average density of raw cow milk samples analyzed was varied from 1.023 g/mL to 1.029 g/mL (Table 1). The highest density was in sample 4 and the lowest density was in sample 1. One-way ANOVA analysis showed that there was a significant difference among the four raw cow milk samples on the values of density, F (3, 8) = 89.086, p<0.001. However, post hoc test revealed the density of sample 1 and 3 were not significantly different.
The normal density of raw milk depends on its composition and temperature; it is in the range of 1.026-1.032 g/mL at 20°C14. For normal whole cow milk, the specific gravity ranges from 1.023-1.032 at 15.6 compared to water (1.000 g/mL) based on the Ethiopian Standards (ES)14. Sebho and Meskel15 suggested that lower value of specific gravity (less than 1.020) is the result of adulteration of milk with water, which contributes to the production of poor quality milk16. Similarly, specific gravity above the recommended level (1.035) indicates adulteration of milk by partial skimming. Based on this, the density of all the raw cow milk samples was within the normal density limit of milk (1.023-1.032 g/mL) as regulated by Ethiopian Standards, 2009. This result is similar with Desye et al.14 who reported a specific gravity of 1.026 for raw cow milk samples in Gondar City, Northwest Ethiopia. Thus, density measurement of milk sample indicates whether the milk composition is altered or not, either by the addition of water, flour or sugar and by the removal of fat.
Titratable acidity (%): In this study, the average titratable acidity ranges from 0.153-0.213 % (Table 1). The highest titratable acidity value was recorded for sample 3 and the lowest was for sample 1. One-way ANOVA analysis showed that there was significant difference among the four raw cow milk samples on the values of titratable acidity (%), f (3, 8) = 61.333, p<0.001. However, post hoc test revealed that the titratable acidity of sample 1 and 4 were not significantly different.
The titratable acidity values for all the four raw milk samples were reasonably lowered than reported acidity values for raw cow milk samples14,16. However, the titratable acidity value of one raw cow milk sample was slightly higher than the acidity limit specified in Compulsory Ethiopian Standard /CES/278 2021 for raw Cow milk14, which might suggest improper raw milk handling and storing practices that resulted in an increased bacterial growth, which in turn increased the titratable acidity. Moreover, milk with high or low titratable acidity levels can alter its taste and texture, as well as make it unsafe to consume. Therefore, it is important to properly handle and store raw cow milk to retain the quality and safety of the milk.
Total solid (%): Total solid represents the total amount of non-water components in milk. The average total solids ranges from 10.57-13.80% (Table 1). The highest value was recorded for sample 1 and the lowest was for sample 3. One-way ANOVA analysis showed that there was a significant difference among the four raw cow milk samples on the values of total solid content (%), f (3, 8) = 78.614, p<0.001. However, post hoc test revealed the total solid content (%) of samples 3 and 4 were not significantly different. The total solids values for three raw milk samples were below the recommended Ethiopian Standard /CES/ 278 2021 for raw Cow milk, total solids should not be less than 12.80%14,15 and were in agreement with reported total solids values for raw cow milk samples16. This might be due to both the practice of adulteration16,18 or genetic variation and differences in the feeding and management practices14.
Total ash content (%): Total ash represents the total minerals in milk. The total ash in raw cow milk samples analyzed were ranged 0.603 to 0.636% (Table 1). The highest value was in sample 2 and the lowest was in sample 3. One-way ANOVA analysis showed that there was insignificant difference among the four raw cow milk samples on the values of total ash content, f (3, 8) = 0.913, p = 0.477.
The average total ash content in all the raw cow milk samples analyzed were slightly less than the EU standard14 for the ash contents of raw cow milk (0.69%). However, the ash content of the raw cow milk samples analyzed were within the usual range, 0.6 to 0.9%, of the ash content of the raw cow milk15. A similar study reported a high average ash content of 0.74% for raw cow milk collected from different value chain actors in Shashemene Town Oromia Region10. These variations in the ash contents of raw cow milk samples might arise from feed quality, breed, stage of lactation and animal health19.
Solid-not-fat (%): Solids-not-fat (SNF) is a measure of the nonfat components of milk. The average solid-not-fat (%) in raw cow milk samples analyzed was in the range of 7.27 to 7.67% (Table 1). The highest value was in sample 2 and the lowest was in sample 3. One-way ANOVA analysis showed that there was no significant difference among the four raw cow milk samples on the values of solid-not-fat content (%), f (3, 8) = 0.913, p = 0.477.
The mean SNF content of all raw cow milk samples analyzed were lower than the minimum recommended SNF content of raw cow milk in the European Union (EU) quality standards (8.25%) and Compulsory Ethiopian standard (8.38%) and were lower than reported SNF values for raw cow milk samples 8.7%20. The low SNF content might be due to the practices of adulteration and other factors such as breed, feeding practices or environmental conditions19.
Total fat (%): The fat content of raw milk indicates its energy value and the average total fat (%) content of raw cow milk samples analyzed were in the range of 3.27 to 6.23% (Table 1). The highest value was in sample 1 and the lowest was in sample 4. One-way ANOVA analysis showed that there was significant difference among the four raw cow milk samples on the values of the total fat content (%), f (3, 8) = 331.984, p<0.001. However, post hoc test revealed the total fat content (%) of samples 3 and 4 were not significantly different.
In this study, two raw cow milk samples had milk fat (3.50%) content higher than the Compulsory Ethiopian standard14, while the other two raw cow milk samples had milk fat content (3.50%) lower than the Compulsory Ethiopian standard as reported by Assen and Abegaz21. The low-fat content might be due to the practices of adulteration22 and other factors such as difference in feeding, management practices, season and breed of the animals22.
Total protein (%): The average total protein content of raw cow milk samples analyzed were in the range of 2.67 to 2.81% (Table 1). The highest value was in sample 2 and the lowest value was in sample 3. One-way ANOVA analysis showed that there were no significant differences among the four raw cow milk samples on total protein content (%), f (3, 8) = 0.913, p = 0.477.
In this study, the protein content of all raw milk samples were below the Compulsory Ethiopian standard14 and European Union quality standards for unprocessed whole milk22. The low protein content for all raw cow milk samples might suggest the presence of under deficiency of crude protein in feeding concentrates or due to factors such as breeds/genetics, health/physiology and environmental/management that influence protein levels in milk production19.
Lactose (%): The average lactose (%) content in raw cow milk samples analyzed was in the range of 4.00 to 4.22% (Table 1). The highest value was in sample 2 and the lowest value was in sample 3. One-way ANOVA analysis showed that there was no significant difference among the four raw cow milk samples on the values of Lactose content (%), F (3, 8) = 0.913, P = 0.477.
The mean lactose (%) content of all raw cow milk samples were close to the recommended EU standard for unprocessed whole milk14,22 and lower than the recommended the normal range O’Connor14. Similarly, the lactose values obtained in this study were lower than reported value (4.76%)16. The low lactose content in raw cow milk sample might be due to feeding low nutrient feed, underfeeding or seasons of the year or low farm-quality control and management23.
Results of the mineral analysis of milk samples: The results of the mineral analysis of raw cow’s milk samples were presented in Table 2. In this study, minerals such as Ca, Mg, Mn and Cu were present in all raw milk samples analyzed, while minerals such as Ni, Co, Cr and Pb were below the detection limit of the instrument used in the mineral analysis. This result is in agreement with similar study that showed minerals such as Co, Ni and Pb were not detected24. However, higher levels of these metals were reported in this research25.
Calcium: The mean calcium concentration in the analyzed raw cow milk samples ranged from 1124.78 to 1505.11 mg/L (Table 2). The highest mean calcium content was found in sample 3 and the lowest mean calcium content was found in sample 1. One-way ANOVA analysis showed that there was a significant difference in the calcium content, f (3, 32) = 77196.999, p<0.001, among the raw cow milk samples.
| Table 2: | Mineral concentration (Mean±SD, n = 9, mg/L) in four milk samples | |||
| Parameters | Sample 1 | Sample 2 | Sample 3 | Sample 4 |
| Calcium | 1124.78±2.77 | 1140.33±1.80 | 1505.11±1.76 | 1137.67±1.41 |
| Magnesium | 103.55±1.94 | 108.33±1.50 | 109.00±1.73 | 102.33±2.06 |
| Copper | 0.082±0.001 | 0.060±0.001 | 0.054±0.001 | 0.076±0.001 |
| Manganese | 0.052±0.001 | 0.071±0.001 | 0.072±0.002 | 0.062± 0.003 |
| Table 3: | Recovery test results (Mean±SD, n = 9, mg/L) for the analysed elements in sample 1 | |||
| Metal | Conc. of unspiked sample (mg/L) |
Amount added (50 μL of 1000 mg/L) = 10 mg/kg |
Conc. spiked sample (mg/L) |
Recovery (%) |
| Ca | 1124.78±2.77 | 10 | 1135.07±2.24 | 102.88 |
| Mg | 103.55±1.94 | 10 | 113.98±1.71 | 104.22 |
| Cu | 0.082±0.001 | 10 | 10.06±0.02 | 99.81 |
| Mn | 0.052± 0.001 | 10 | 10.06±0.01 | 100.11 |
| Recovery (%) values for all the analysed minerals lie within the range 99.8 to 104.2%. This recovery values are within the acceptable recovery ranges 80-120 %, which showed that the sample preparation methods as well as the method of analysis were accurate | ||||
The results of the calcium content of the raw cow’s milk samples were higher than the result reported by Küçük and Gökçek26. However, calcium levels ranging from 900 to 1200 mg/L were also reported in literature26,27.
Magnesium: The mean magnesium concentration in the analyzed raw cow milk samples ranged from 102.33 to 109.00 mg/L (Table 2). The highest mean magnesium content was found in sample 3 and the lowest mean magnesium content was found in sample 4. One-way ANOVA analysis showed that there was a significant difference in the magnesium content, f (3, 32) = 30.469, p<0.001, among the raw cow milk samples. However, post hoc testing revealed that the mean magnesium concentration obtained for milk sample 2 and milk sample 3 was statistically similar. Similarly, post hoc testing revealed that the mean magnesium concentration obtained for milk sample 1 and milk sample 4 was statistically similar.
The results of the magnesium content of the raw cow’s milk samples were lower than the results reported by Küçük and Gökçek26, as 197.81-294.19 mg/L mg/L for raw milk samples.
Copper: The mean copper concentrations ranged from 0.0536 to 0.0817 mg/L (Table 2). The highest mean copper content was found in sample 1 and the lowest mean copper content was found in sample 3. One-way ANOVA analysis showed that there was a significant difference in the copper content, f (3, 32) = 570.108, p<0.001, among the raw cow milk samples.
The results of the copper content of the raw cow’s milk samples were far below the results reported by previous studies27-30. These values exceeded the Standardization Administration of the People’s Republic of China (0.01 mg/L)31. This might be attributed to environmental contamination32.
Manganese: The mean manganese concentration in the analyzed raw cow milk samples ranged from 0.052 to 0.0716 mg/L (Table 2). The highest mean manganese content were found in milk sample 3 and the lowest mean manganese content was found in milk sample 1. One-way ANOVA analysis showed that there was a significant difference in the manganese content, F (3, 32) = 6476.611, p<0.001, among the raw cow milk samples. However, post hoc testing revealed that the mean calcium concentration obtained for milk sample 2 and milk sample 3 were statistically similar.
The results of the manganese content of the raw cow milk samples exceeded the maximum limit for manganese guideline values based on the World Health Organization33. The high concentration of manganese might be due to the use of feeds high in organic Mn (beets, squash and tulip bulbs), enrichment of feed with manganese-containing salts and the use of deep wells31.
Results of the recovery experiment: A recovery experiment was carried out using a selected raw cow’s milk sample (Sample 1). The results of the (%) recovery experiment for the elements found in sample 1 are shown in Table 3.
CONCLUSION
This study provides information on the physicochemical parameters and elemental contents of raw cow’s milk sold in informal markets in Hawassa City, Sidamma Region, Ethiopia. The result showed that the average values of pH, specific gravity, titratable acidity, total ash and lactose were within the acceptable standard specified in the Compulsory Ethiopian Standard for raw whole cow milk specifications. However, the average values of total fat, total protein and solid-not-fat were found to be below the recommended limits. Furthermore, the average water added content of the raw cow milk samples were in the range of 5.54% to 10.33%. These might be due to the addition of water or other substances and other factors such as breed, feeding practices or management practices, season and breed of the animals.
Minerals such as Ca, Mg, Mn and Cu were present and quantified in all raw cows’ milk samples while minerals such as Ni, Co, Cr and Pb were below the instrument detection limit. However, further research should be conducted in order to make a strong conclusion regarding the physicochemical quality and the metal content of the milk sold in informal markets in Hawassa City, Sidamma Region, Ethiopia.
SIGNIFICANCE STATEMENT
This study discovered the nutritional deficiencies and physicochemical variations in raw cow’s milk sold in informal markets of Hawassa, which can be beneficial for public health authorities, dairy producers and consumers in ensuring milk safety and nutritional adequacy. By identifying low levels of fat, protein and solids-not-fat, alongside acceptable pH, density and metal content, the findings provide critical insights into the quality of milk consumed locally. Furthermore, the assessment of metal concentrations highlights potential health risks and nutritional benefits associated with essential minerals. This study will help researchers to uncover the critical areas of milk quality and safety that many researchers were not able to explore. Thus, a new theory on the impact of informal market practices on milk nutrition may be arrived at.
FUNDING
The research was funded by the Ministry of Education of Ethiopia.
ACKNOWLEDGMENT
We would like to acknowledge the Ministry of Education of Ethiopia for funding the research and Hawassa University for allowing its research Lab to conduct the experiments.
REFERENCES
- Patra, R.C., D. Swarup, P. Kumar, D. Nandi, R. Naresh and S.L. Ali, 2008. Milk trace elements in lactating cows environmentally exposed to higher level of lead and cadmium around different industrial units. Sci. Total Environ., 404: 36-43.
- Sanjulián, L., S. Fernández-Rico, N. González-Rodríguez, A. Cepeda and J.M. Miranda et al., 2025. The role of dairy in human nutrition: Myths and realities. Nutrients, 17.
- Kazi, T.G., N. Jalbani, J.A. Baig, G.A. Kandhro and H.I. Afridi et al., 2009. Assessment of toxic metals in raw processed milk samples using electrothermal atomic absorption spectrophotometer. Food Chem. Toxicol., 47: 2163-2169.
- Anger, J.C., C. Loncke, C. Omphalius, M. Boutinaud, J. Guinard-Flament, H. Lapierre and S. Lemosquet, 2024. Synthesis of milk components involves different mammary metabolism adaptations in response to net energy and protein supplies in dairy cows. J. Dairy Sci., 107: 2883-2899.
- Moonajilin, M.S., M. Saiful Islam and R. Paul, 2018. A study on milk adulteration of Savar Upazila in Bangladesh. Int. J. Community Med. Public Health, 5: 4670-4675.
- Singh, P. and N. Gandhi, 2015. Milk preservatives and adulterants: Processing, regulatory and safety issues. Food Rev. Int., 31: 236-261.
- Fischer, W.J., B. Schilter, A.M. Tritscher and R.H. Stadler, 2011. Contaminants of milk and dairy products: Contamination Resulting from Farm and Dairy Practices. In: Encyclopedia of Dairy Sciences, Fuquay, J.W. (Ed.), Elsevier, Amsterdam, Netherlands, ISBN: 978-0-12-374407-4, pp: 887-897.
- Gonzalez, N.C., M. Pérez-Sato, E. Soni-Guillermo, E. Valencia-Franco, M. Carmona-Victoria and F. Calderón-Sánchez, 2022. Nitric acid and hydrogen peroxide in the digestion of milk and cheeses for the detection of heavy metals. Agro Productividad, 15: 61-70.
- Siddique, A. and Y.W. Park, 2019. Evaluation of correlation between acid degree value and peroxide value in lipolysis of control and iron fortified caprine milk cheeses during 4 months storage. Open J. Anim. Sci., 9.
- Gemetchu, T., F. Beyene and M. Eshetu, 2015. Physical and chemical quality of raw cow's milk produced and marketed in Shashemene Town, Southern Ethiopia. ISABB J. Food Agric. Sci., 5: 7-13.
- Gwandu, S.H., H.E. Nonga, R.H. Mdegela, A.S. Katakweba, T.S. Suleiman and R. Ryoba, 2018. Assessment of raw cow milk quality in smallholder dairy farms in Pemba Island Zanzibar, Tanzania. Vet. Med. Int., 2018.
- Aggarwal, A., T. Verma and S. Ghosh, 2022. Heavy Metal Residues in Milk and Milk Products and their Detection Method. In: Trends and Innovations in Food Science, El-Samragy, Y. (Ed.), IntechOpen, London, United Kingdom, ISBN: 978-1-80356-066-3.
- Zigde, H.M. and B.N. Begna, 2023. Physicochemical characteristics of drinking water sources and household tape water in Yabelo Town. Trends Appl. Sci. Res., 18: 131-148.
- Desye, B., B.D. Bitew, D.E. Amare, T.A. Birhan, A. Getaneh and Z.H. Gufue, 2023. Quality assessment of raw and pasteurized milk in Gondar city, Northwest Ethiopia: A laboratory-based cross-sectional study. Heliyon, 9.
- Sebho, H.K. and D.H. Meskel, 2018. Determination of adulteration and chemical composition of raw milk sold in Hossana Town, South Ethiopia. J. Dairy Vet. Sci., 6.
- Zebib, H., D. Abate and A.Z. Woldegiorgis, 2023. Nutritional quality and adulterants of cow raw milk, pasteurized and cottage cheese collected along value chain from three regions of Ethiopia. Heliyon, 9.
- Asefa, Z. and G. Teshome, 2019. Physical properties and chemical compositions of raw cow milk in milk shades around Addis Ababa, Ethiopia. J. Nat. Sci. Res., 9: 33-37.
- Dangi, S., 2021. Common milk adulterants in developing country Nepal: A short review. Aceh J. Anim. Sci., 6: 91-96.
- Auldist, M.J., K.A. Johnston, N.J. White, W.P. Fitzsimons and M.J. Boland, 2004. A comparison of the composition, coagulation characteristics and cheese making capacity of milk from Friesian and Jersey dairy cows. J. Dairy Res., 71: 51-57.
- Bille, P.G., B.R. Haradoeb and N. Shigwedha, 2009. Evaluation of chemical and bacteriological quality of raw milk from neudamm dairy farm in Namibia. Afr. J. Food Agric. Nutr. Dev., 9: 1511-1523.
- Assen, K.A. and M.A. Abegaz, 2024. Review on quality attributes of milk and commonly produced dairy products in Ethiopia. Heliyon, 10.
- Anagaw, Y.K., W. Ayenew, L.W. Limenh, D.T. Geremew and M.C. Worku et al., 2024. Food adulteration: Causes, risks, and detection techniques-review. SAGE Open Med., 12.
- Antanaitis, R., K. Džermeikaitė, J. Krištolaitytė, A. Girdauskaitė, S. Arlauskaitė, K. Tolkačiovaitė and W. Baumgartner, 2024. The relation between milk lactose concentration and the rumination, feeding, and locomotion behavior of early-lactation dairy cows. Animals, 14.
- Belete, T., A. Hussen and V.M. Rao, 2014. Determination of concentrations of selected heavy metals in cow’s milk: Borena Zone, J. Health Sci., 4: 105-112.
- Perween, R., S.S. Shaukat, K. Yasmeen and D. Ara, 2016. Evaluation of environmental impact on heavy metal load in cattle milk. Pol. J. Environ. Stud., 25: 1161-1166.
- Küçük, N.Y. and R. Gökçek, 2024. Determination of some minerals and heavy metals in raw cow’s milk. Afyon Kocatepe Univ. J. Sci. Eng., 24: 839-846.
- Bakircioglu, D., N. Topraksever, S. Yurtsever, M. Kizildere and Y.B. Kurtulus, 2018. Investigation of macro, micro and toxic element concentrations of milk and fermented milks products by using an inductively coupled plasma optical emission spectrometer, to improve food safety in Turkey. Microchem. J., 136: 133-138.
- Fiorentini, D., C. Cappadone, G. Farruggia and C. Prata, 2021. Magnesium: Biochemistry, nutrition, detection, and social impact of diseases linked to its deficiency. Nutrients, 13.
- Hasan, G.M.M.A., M.H. Kabir and M.A.S. Miah, 2022. Determination of heavy metals in raw and pasteurized liquid milk of Bangladesh to assess the potential health risks. Food Res., 6: 233-237.
- Akele, M.L., D.Z. Abebe, A.K. Alemu, A.G. Assefa, A. Madhusudhan and R.R. de Oliveira, 2017. Analysis of trace metal concentrations in raw cow’s milk from three dairy farms in North Gondar, Ethiopia: Chemometric approach. Environ. Monit. Assess., 189.
- Alinezhad, Z., M. Hashemi and S.B.T. Sany, 2024. Concentration of heavy metals in pasteurized and sterilized milk and health risk assessment across the globe: A systematic review. PLoS ONE, 19.
- Shahbazi, Y., F. Ahmadi and F. Fakhari, 2016. Voltammetric determination of Pb, Cd, Zn, Cu and Se in milk and dairy products collected from Iran: An emphasis on permissible limits and risk assessment of exposure to heavy metals. Food Chem., 192: 1060-1067.
- Issa, S.Y., D.M. Genena, M.K. Al Mazroua, S.M. Abdel Rahman and M.M. Fawzi, 2016. Determination of some metals in the commonly consumed dairy products randomly collected from the market in Alexandria-Egypt, with an emphasis on toxicity, permissible limits and risk assessment. Int. J. Pharmacol. Toxicol., 4: 133-137.
How to Cite this paper?
APA-7 Style
Lorenso,
G.A., Zigde,
H.M. (2025). Assessment of Physicochemical Properties and Mineral Composition of Fresh Raw Cow Milk in Hawassa City, Sidama Region, Ethiopia. Trends in Applied Sciences Research, 20(1), 107-115. https://doi.org/10.3923/tasr.2025.107.115
ACS Style
Lorenso,
G.A.; Zigde,
H.M. Assessment of Physicochemical Properties and Mineral Composition of Fresh Raw Cow Milk in Hawassa City, Sidama Region, Ethiopia. Trends Appl. Sci. Res 2025, 20, 107-115. https://doi.org/10.3923/tasr.2025.107.115
AMA Style
Lorenso
GA, Zigde
HM. Assessment of Physicochemical Properties and Mineral Composition of Fresh Raw Cow Milk in Hawassa City, Sidama Region, Ethiopia. Trends in Applied Sciences Research. 2025; 20(1): 107-115. https://doi.org/10.3923/tasr.2025.107.115
Chicago/Turabian Style
Lorenso, Giro, Ashenafi, and Haile Melaku Zigde.
2025. "Assessment of Physicochemical Properties and Mineral Composition of Fresh Raw Cow Milk in Hawassa City, Sidama Region, Ethiopia" Trends in Applied Sciences Research 20, no. 1: 107-115. https://doi.org/10.3923/tasr.2025.107.115

This work is licensed under a Creative Commons Attribution 4.0 International License.