
Assessment of Physicochemical Composition and Metal Content of Honey Collected from the Guji Zone, Oromia Regional State, Ethiopia
-
Dulecha Alemu Zeleke
Irba Muda Secondary School, Irba Muda Town, Anna Sora District, Guji Zone Oromia Regional State, Ethiopia
Haile Melaku Zigde

Chemistry Department, College of Natural and Computational Science, Hawassa University, Hawassa, Ethiopia
| Received 17 Jan, 2026 |
Accepted 02 Jun, 2026 |
Published 21 Jun, 2026 |
Background and Objective: Honey should be free from contaminants and adulterants that can directly or indirectly affect consumer health. Regular assessment of honey quality is essential to ensure its safety in the domestic market. This study aimed to determine selected physicochemical parameters and metal contents in honey samples collected from Adola Rede, Bore, Ana Sora, and Dama districts of Guji Zone, Oromia Regional State, Ethiopia. Materials and Methods: Physicochemical parameters measured included pH, electrical conductivity (μS/cm), moisture (%), total ash (%), and free acidity (meq/kg). Metals analyzed included Ca, Mg, Cu, Mn, Ni, Co, Cr, and Pb. The pH and electrical conductivity were measured using an AD8000 pH/mV/EC/TDS/Temp meter. Moisture and total ash were determined gravimetrically, free acidity by titration, and metal contents by flame atomic absorption spectrometry (FAAS). One-way ANOVA was performed to test differences among honey samples, with significance set at p<0.05, using IBM SPSS 20. Results: The mean values of physicochemical parameters were: pH (3.50-3.95), electrical conductivity (0.220-0.850 μS/cm), moisture (6.66-18.3%), total ash (0.23-0.73%), and free acidity (20.3-37.0 meq/kg). The mean metal concentrations were: Ca (79.9-145.0 mg/L), Mg (552.2-1030.1 mg/L), and Cu (1.22-1.55 mg/L). Mn, Ni, Co, Cr, and Pb w ere below detection limits. Significant differences (p<0.05) were observed among samples for both physicochemical parameters and metals. All measured parameters were below the maximum limits set by Ethiopian Standard, FAO/WHO, and EU guidelines. Conclusion: Honey produced in the Guji Zone is of good quality, safe for consumption, and can serve as a valuable source of nutrients in the human diet.
| Copyright © 2026 Zeleke and Zigde. This is an open-access article distributed under the Creative Commons Attribution License, which permits unrestricted use, distribution, and reproduction in any medium, provided the original work is properly cited. |
INTRODUCTION
Honey is a natural sweet substance produced by honey bees from floral nectar or from secretions obtained from living plant tissues. After collection, bees transform these materials through enzymatic processes and store the final product in honeycombs1. Chemically, honey is dominated by carbohydrates, which typically account for about 80-85% of its composition. It also contains smaller proportions of water (approximately 17-20%), proteins (around 0.3%), and mineral elements ranging from 0.01% to 1.0%. In addition, honey includes a variety of minor constituents such as organic acids, enzymes, vitamins, and antioxidant compounds that contribute to its nutritional and functional properties2,3.
The physicochemical characteristics of honey are not constant and may vary depending on its botanical and geographical origin. The type of flowering plants available to bees, as well as the diversity of vegetation in the surrounding environment, plays a significant role in determining the final composition of honey. Consequently, environmental conditions and ecosystem diversity strongly influence the chemical profile of honey produced in a given region4.
Among the various factors affecting honey composition, the presence of metallic elements is closely associated with soil characteristics and plant species growing in the area. Plants absorb mineral elements from the soil through their root systems, which are subsequently transferred to plant tissues and nectar. These elements can then enter the honey during the process of nectar collection and transformation by bees5. In addition to natural sources, human-related activities such as industrial emissions, disposal of solid wastes, traffic pollution, and the intensive use of agricultural chemicals may contaminate environmental components including soil, water, and air. Such contamination can increase the concentration of trace elements in honey, potentially influencing its quality and safety6.
Ethiopia has produced honey from traditional beehives7,8. Guji Zone is one of the potential honey production sites in the Oromia Regional State of Ethiopia. In various Districts of Guji Zone, honey is produced from multiflora, where there is an availability of diversified natural agroforestry and plant species. In these Districts, similar to other honey-producing areas of the regions in Ethiopia, producers used traditional beehives for honey production, which results in a relatively low honey supply and poor quality of honey due to the addition of smoke and dirt9. Thus, this study aimed to determine the physicochemical and metal composition of honey produced in four Districts of Guji Zone, Oromia Regional State, Ethiopia to check their qualities and seize the domestic and international honey market opportunities.
MATERIALS AND METHODS
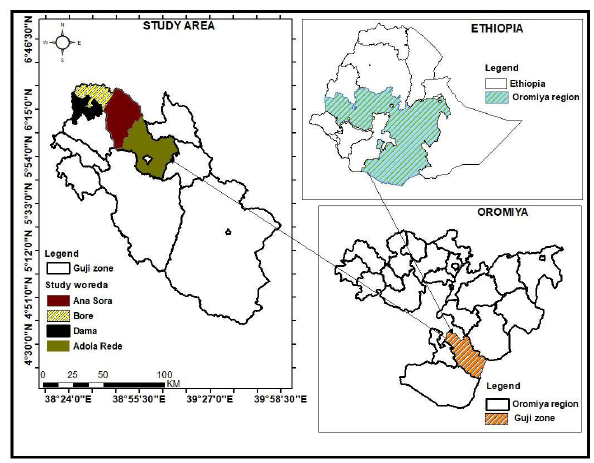
Description of the study area: The study was conducted in Guji Zone, Oromia Regional State of Ethiopia (Fig. 1), located about 604 km South of Addis Ababa, the capital city of Ethiopia. It is found between 38-40° East Longitude and Latitude 4-5° on the North, and the altitude ranges from 500 m up to 3500 m above sea level. The area of the Zone is estimated to cover about 18,557.05 km2 or 3,545,400 hectares. About 1,392,048.05 hectares is arable land, 702,080 hectares is grazing land, and 1,167,145 hectares is forest land10. The zone has three types of climate conditions: Dega, Woina Dega, and Kolla and accounts for 13, 19, and 68%, respectively, and has a bi-modal rain season, namely the summer (June to November) and spring (March to May). The location map of the study area is shown in Fig. 1.
Sample collection, preparation, and analysis
Sample collection: According to the Guji Zone Agricultural Bureau, the Districts, namely Adola Rede, Ana Sora, Bore, and Dama, are highly productive in honey production. Therefore, four composite honey samples were collected from beekeepers found in each of the selected four districts of the sampling area. Approximately 1.0 kg of honey samples from each district were collected in polyethylene containers between June 2024 and August 2024 and transported to Hawassa University research laboratory for chemical analysis.
|
Analysis of the physicochemical quality of honey
Determination of moisture: The determination of water content was carried out using the thermogravimetric method proposed by AOAC11, and it was performed in triplicate. Two grams of honey were measured and put in the oven for 5 hours at 110°C. Then it was cooled in a desiccator for 10 minutes and weighed. The sample was put back into the oven for 30 minutes, cooled in a desiccator, and weighed. The treatment was performed several times until it reached a constant weight, and the water content was calculated by the formula:
Determination of ash content: Determination of ash content was carried out based on SNI 01-2891-199212. About 2 grams of honey sample was weighed and put in a crucible/porcelain dish of known weight and dried in the furnace at 550°C for 8 hours. The sample is cooled, put in a desiccator, and weighed to a constant weight. The experiment was performed in triplicate. The formula used to calculate ash content:
where, w1 is Weight of sample and crucible after ashing (g), w2 is Weight of sample and crucible before ashing (g) and w is Weight of empty crucible (g)
Determination of electrical conductivity: The determination of the electrical conductivity of honey is based on measuring the electrical resistance, of which the electrical conductivity is reciprocal, by way of a conductivity meter as prescribed by International Honey Commission Methods13. Electrical conductivity was measured at 20°C in solutions of honey samples (20.0 g dry matter of honey sample mixed with distilled water to make 100 mL of solution) using AD8000 pH/mV/EC/TDS/Temp meter. The measurement was performed in triplicate.
Determinations of pH: The pH determination was performed according to the techniques described in the International Honey Commission Method13. Ten grams (10.0 g) of honey was weighed in an analytical balance and diluted in 75.0 mL of distilled water; the sample was then homogenized and read using an AD8000 pH/mV/EC/TDS/Temp meter calibrated with appropriate buffers (buffer solutions with pH = 7.0 and pH = 4.0). The experiment was performed in triplicate.
Determination of free acidity: The acidity of honey was determined by the volumetric method (International Honey Commission Method13. Ten grams of the honey sample was measured and dissolved in 75 mL of distilled water. The pH of the solution was measured and recorded by immersing the pH electrodes in the solution that was stirred with a magnetic stirrer. Then, 3-5 drops of phenolphthalein indicator solution (1%) was added and the solution was slowly titrated with 0.1 M NaOH until it reached a pH of 8.30. The reading was recorded. Similarly, a blank was analyzed by titrating 75 mL of distilled water with 0.1 M NaOH to pH 8.30. The reading was recorded, and free acidity was calculated in milliequivalents per kilogram (meq/kg). The experiment was performed in triplicate.
 |
Analysis of the metal content of honey: Acid digestion was used to prepare honey samples for metal analysis14. The metal contents of the digested honey samples were determined by flame atomic absorption spectrometry according to the methods of AOAC15.
Data analysis: Descriptive statistics were used to summarize the values of the physicochemical parameters and metal content of the honey samples. One-way Analysis of Variance (ANOVA) was performed to test whether the differences among honey samples were statistically significant, with a significance level set at p<0.05. Post hoc comparisons were conducted using Tukey’s test where applicable. All statistical analyses were performed using IBM SPSS 20 software.
RESULTS AND DISCUSSION
Results of the physicochemical analysis of honey samples: The results (minimum, maximum, and average) of the physicochemical parameters of honey samples analysed in the present study are indicated in Table 1 and 2.
pH: The pH values of honey samples analyzed in the Adola Rede District ranged from 3.49 to 3.51 with a mean value of 3.50 (Table 1). Similarly, the pH values of honey samples analyzed in the Bore, Ana Sora, and Dama Districts ranged from 3.63-3.65, 3.77-3.79, and 3.94-3.96, respectively. These pH values indicated that all the honey samples considered in this study were acidic and had low pH values. It was also observed that the average pH value of the honey sample from Dama was the highest (3.95), and the pH value of the honey sample from Adola Rede was the lowest (3.50). All the mean pH values were within the range of 3.2 to 4.5, which is in the recommended honey pH range according to Bogdanov et al.16. These average pH values were comparable with the previously reported pH value, which is 3.63-5.0117 for honey from Madrid and 3.0-3.8818 for the Hatay region of blossom honey. In general, lower pH is linked with the fermentation of sugars present in the honey into organic acid. Blossom honey has a pH range from 3.5 to 4.5, yet honey over 5 is considered low quality18. The results of a one-way ANOVA analysis showed that there was a significant difference among the honey samples obtained from the four different locations on the values of pH, F (2, 6) = 1112.750, p<0.001.
Electrical conductivity: Electrical conductivity reflects the presence of ionizable acids and other charged compounds in an aqueous solution. In the present study, the electrical conductivity values of honey samples obtained from different districts showed some variation (Table 1). Samples collected from Adola Rede exhibited values ranging from 0.219 to 0.221 mS/cm, while those from Bore ranged between 0.849 and 0.851 mS/cm. Honey samples from Ana Sora showed conductivity values between 0.240 and 0.290 mS/cm, whereas samples from Dama District ranged from 0.640 to 0.680 mS/cm.
| Table 1: | Physicochemical properties of honey samples collected from four districts of the Guji Zone, Oromia, Ethiopia (Mean±SD, n = 3) | |||
| pH | Electrical conductivity (mS/cm) | Moisture (%) | ||||
| Sample location | Mean±SD | Range | Mean±SD | Range | Mean±SD | Range |
| Adola Rede | 3.50±0. 01 | 3.49-3.51 | 0.220±0.01 | 0.219-0.221 | 15.0±5.0 | 10.0-20.0 |
| Bore | 3.64±0.01 | 3.63-3.65 | 0.850±0.01 | 0.849-0.8.51 | 6.66±2.9 | 5.00-10.0 |
| Ana Sora | 3.78±0. 01 | 3.77-3.79 | 0.265±0.25 | 0.240-0.290 | 10.0±5.0 | 5.00-15.0 |
| Dama | 3.95±0.01 | 3.94-3.96 | 0.660±0.20 | 0.640-0.680 | 18.3±2.9 | 15.0-20.0 |
| Table 2: | Total ash content and free acidity of honey samples collected from four districts of the Guji Zone, Oromia, Ethiopia (Mean±SD, n = 3) | |||
| Total ash (%) | Free acidity (meq/Kg) | |||
| Sample location | Mean±SD | Range | Mean±SD | Range |
| Adola Rede | 0.73±0.02 | 0.712-0.750 | 20.3±1.5 | 19.0-22.0 |
| Bore | 0.41±0.02 | 0.390-0.430 | 23.3±1.5 | 22.0-25.0 |
| Ana Sora | 0.24±0.04 | 0.214-0.280 | 32.0±2.0 | 30.0-34.0 |
| Dama | 0.23±0.02 | 0.210-0.252 | 37.0±1.0 | 36.0-38.0 |
The average electrical conductivity values in the investigated honey samples were between 0.220 and 0.850 mS/cm, and electrical conductivity was below the maximum limit of 0.8 mS/cm set by the EU in three of four tested honey samples19. The average electrical conductivity values in the investigated honey samples were comparable with previously reported electrical conductivity values, which are in the range of 0.119-1.515 mS/cm17 for honey from Madrid, and in the range of 0.30-0.99 mS/cm20 for honey from Spain. Therefore, the electrical conductivity of honey samples from this study is generally compatible with the electrical conductivity of other honey in the literature. The results of a One-way ANOVA analysis of the values of the electrical conductivity showed a significant difference among the honey samples obtained from the four different locations, F (2, 6) = 1097.249, p<0.001.
Moisture (% by mass): The moisture content of the analysed honey samples collected from Adola Rede, Bore, Ana Sora, and Dama Districts ranged from 10.0-20.0, 5.00-10.0, 5.00-15.00, and 15.0-20.0%, respectively (Table 1). Honey samples from Bore have the lowest average moisture content with a value of 6.66%, while the Dama honey sample has the highest moisture content, 18.3%. However, the average moisture content in all investigated honey samples was below 21%, the maximum permitted level set by FAO/WHO and EU regulations for honey19,21. If the moisture content of honey is greater than 19%, it shows undesirable honey fermentation. Thus, the low moisture content is a good sign for a more excellent and longer period of usability of honey22. A previous study regarding the moisture content of honey samples had reported a moisture content of 17.89±1.0223. Getu and Birhan24 reported an average moisture content of 19.97% and 18.5% for honey samples collected from Debre-Nazret of the Tigray Region and Northern Gonder, respectively. The results of a One-way ANOVA analysis showed that there was a significant difference among the honey samples obtained from the four different locations on the values of moisture content, F (2, 6) = 4.833, P = 0.033. However, the post hoc test revealed that the moisture content of honey samples from Ana Sora and Adola Rede were statistically similar.
Total ash (% by mass): The ash content of the honey samples obtained from Adola Rede, Bore, Ana Sora, and Dama Districts ranged from 0.712-0.750, 0.390-0.430, 0.214-0.280, and 0.210-0.252%, respectively, with maximum average ash content was recorded in Adola Rede and the minimum value recorded in Dama (Table 2). The ash content of honey is related to the geographical and botanical origin of the honey5. The average ash content of Dama, Ana Sora, and Bore honey samples was below the maximum ash content of honey,0.6%, set by the Ethiopian and EU standards19,25, while the average ash content of Adola Rede honey samples was above the limit set by Ethiopian and EU standards (<6% ash content) for honey quality.
A previous study regarding the ash content of honey samples in Ethiopia had reported an ash content of 0.34±0.05 (from Gambella), by Berhe et al.26, 0.39±0.04 (from Bale) by Belay et al.27, and 0.21±0.01 (from Amhara and Tigray Regions) by Lewoyehu and Amare28. The results of a One-way ANOVA analysis on the values of ash content showed a significant difference among the honey samples obtained from the four different locations, F (2, 6) = 232.060, p<0.001. However, the Post hoc test revealed that the ash content of honey samples from Dama and Ana Sora was statistically similar.
Free acidity (meq/kg): Free acidity indicates one of the quality parameters of honey samples and it reveals whether the honey is fermented or not29. However, if the amount of acid in honey contains the required level, it contributes to keeping the flavor of honey, improves antioxidant activity, and protects from multiplying harmful microorganisms in honey30. The free acidity values of the honey samples obtained from Adola Rede, Bore, Ana Sora, and Dama Districts ranged from 19.0-22.0, 22.0-25.0, 30.0-34.0, and 36.0-38.0 meq/kg, respectively (Table 2). In this study, the average free acidity values ranged between 20.3 and 37.0 meq/kg. Thus, free acidity in all tested honey samples was below the Ethiopian Standard, WHO/FAO, and EU guidelines of honey quality (<40 meq/kg)21,25,31.
The lowest mean free acidity value (20.3±1.5 meq/kg) was observed in the honey sample collected from Adola Rede, whereas the highest value (37.0±1.0 meq/kg) was recorded for the sample obtained from Dama District. The differences in free acidity among the samples could be attributed to several factors, including the harvesting period, degree of honey maturity, botanical origin, geographical location, storage conditions, and climatic variations. These factors may promote chemical, enzymatic, and microbial processes that lead to the formation of acidic compounds in honey32,33.
Furthermore, the free acidity levels measured in the present study are consistent with values reported in previous studies. Comparable results include 29.74±2.20 meq/kg reported by Lewoyehu and Amare28, 34.57±4.80 meq/kg reported by Belay et al.27, 27.0±3.07 meq/kg reported by Adgaba et al.34, and 25.95 meq/kg reported by Equar et al.23.
The results of a One-way ANOVA analysis showed a significant difference among the honey samples obtained from the four different locations on the values of free acidity, F (2, 6) = 73.425, p<0.001. However, the post hoc test revealed that the free acidity content of honey samples from Adola Rede and Bore were not statistically different.
Results of the metal analysis of honey samples: The results (minimum, maximum, and average) of the concentration of the elements analyzed for each honey sample taken from the selected District of the Guji Zone are presented in Table 3. Ca, Mg, and Cu were present in all honey samples, while the concentrations of Mn, Ni, Co, Cr, and Pb were found to be below the detection limit of the instrument.
Metal content determined using Flame Atomic Absorption Spectrometry (FAAS)
Calcium: The calcium concentration in honey samples collected from Adola Rede, Bore, Ana Sora, and Dama Districts ranged from 116.0-132.0, 70.0-86.0, 140.0-153.3, and 100.0-110.0 mg/kg, respectively (Table 3). Honey samples from Ana Sora have the highest average calcium content with a value of 145.0±0.51 mg/kg, while honey sample from Bore District has the lowest calcium content with a value of 79.9±0.51 mg/kg. However, the average calcium content in all investigated honey samples was far less than the desired level recommended by Codex Alimentarius Limits35.
| Table 3: | Concentration of metals (Ca, Mg, Cu) in honey samples from four districts of the Guji Zone, Oromia, Ethiopia (Mean±SD, n = 9; values in mg/kg) | |||
| Ca | Mg | Cu | ||||
| Sample location | Mean±SD | Range | Mean±SD | Range | Mean±SD | Range |
| Adola Rede | 125.9±0.54 | 116.0-132.0 | 774.66±6.83 | 710.0-873.3 | 1.22±0.06 | 1.14-1.30 |
| Bore | 79.9±0.51 | 70.0-86.0 | 969.18±3.86 | 898.0-1016.0 | 1.38±0.09 | 1.26-1.53 |
| Ana Sora | 145.0±0.51 | 140.0-153.3 | 1030.07±1.29 | 1010.0-1050.0 | 1.44±0.06 | 1.30-1.50 |
| Dama | 103.9±0.41 | 100.0-110.0 | 552.15±1.69 | 526.0-580.0 | 1.55±0.04 | 1.50-1.60 |
| Mean±SD: Mean value±standard deviation (n = 9), Ca: Calcium content in mg/kg, Mg: Magnesium content in mg/kg and Cu: Copper content in mg/kg. Values of Mn, Ni, Co, Cr, and Pb were below the detection limits of the instrument | ||||||
A previous study had reported a calcium concentration of 44.88-68.55 mg/kg, for honey samples collected from the Dawuro Zone, SNNPR Region36, which are lower than values obtained in the present study. In contrast, another study by Lomiso et al.37 found considerably higher calcium levels, ranging from 420.4 to 551.9 mg/kg, in honey samples from the Chena District of the Amhara Region. The observed differences in calcium concentration among studies may be attributed to variations in botanical origin, environmental conditions, and geographical characteristics of the honey-producing areas.
The results of one-way ANOVA analysis showed that there was a significant difference in the calcium content, F (3, 32) = 289.777, p<0.001, among the honey samples obtained from the selected District of the Guji Zone.
Magnesium: The magnesium concentration in honey samples collected from Adola Rede, Bore, Ana Sora, and Dama Districts was ranged from 710.0-873.3, 898.0-1016.0, 1010.0-1050.0 and 526.0-580.0 mg/kg respectively (Table 3). Honey samples from Ana Sora have the highest average magnesium content with a value of 1030.07± 1.29 mg/kg. The honey sample from the Dama District has the lowest calcium content with a value of 552.15±1.69 mg/kg. However, the average magnesium content in all investigated honey samples was far greater than the findings of Engidaw et al.36 and Lomiso et al.37, who had reported magnesium content ranging from 15.61-26.93 mg/kg in honey samples, collected from the Dawuro Zone, SNNPR Region, and magnesium content ranging from 29.6-47.7 mg/kg in honey samples collected from the Chena District, Amhara Region, respectively. The difference in the level of minerals like magnesium in honey is due to the botanical origin and soil composition. This is because most of the minerals in honey originate from the soil38. Similarly, Afroz et al.39 stated that the variability in mineral content from different locations can be attributed to botanical, environmental, and geographical factors.
The results of One-way ANOVA analysis showed that there was a significant difference in the magnesium content, F (3, 32) = 253.677, p<0.001, among the honey samples obtained from the selected District of the Guji Zone.
Copper: The copper concentration in honey samples collected from Adola Rede, Bore, Ana Sora, and Dama Districts ranged from 1.14-1.30, 1.26-1.53, 1.30-1.50, and 1.50-1.60 mg/kg, respectively (Table 3). Honey samples from Dama have the highest average magnesium content with a value of 1.55±0.04 mg/kg. The honey sample from the Adola Rede District has the lowest calcium content with a value of 1.22±0.06 mg/kg. However, the average copper content in all investigated honey samples was far greater than the findings of Engidaw et al.36 who reported copper content ranging from 0.12-0.29 mg/kg in honey samples collected from the Dawuro Zone, SNNPR Region.
One-way ANOVA analysis showed a significant difference in the copper content, F (3, 32) = 39.575, p<0.001, among honey samples obtained from the selected District of the Guji Zone. However, the post hoc test revealed that the copper content of honey samples from Bore and Ana Sora were statistically similar.
CONCLUSION
Honey quality parameters such as pH, electrical conductivity, moisture, total ash, and free acidity, and minerals such as (Ca, and Mg), trace elements (Cu, Mn, Ni, and Co), and heavy metals (Cr and Pb) were analysed to evaluate the quality of honey samples collected from the selected District of Guji Zone, Oromia Regional State, Ethiopia. The result showed that the values of the analysed honey quality parameters were in agreement with the standards and guidelines set by the Ethiopian Standard, FAO/WHO, and EU. In addition, the concentration of metals such as Mn, Ni, Co, Cr, and Pb was found to be below the detection limit of the instrument. Therefore, the findings of the research suggested that the honey produced in the Guji Zone, Oromia Regional state, Ethiopia, is considered to be high quality, safe for consumption, and it can be a good supplement for the daily human nutrient requirement. However, more honey samples from the districts should be taken and analysed to strengthen the conclusion.
SIGNIFICANCE STATEMENT
The study demonstrates that honey produced in the Guji Zone possesses physicochemical properties and metal concentrations within acceptable limits, indicating good quality and safety for consumption. Significant variations (p<0.05) in pH, moisture, electrical conductivity, ash content, free acidity, and mineral levels among districts reflect the influence of geographical and botanical origin. These findings provide valuable data for quality control, consumer safety, and potential market expansion of Guji honey.
FUNDING
This research was funded by the Ministry of Education of Ethiopia.
ACKNOWLEDGMENT
We acknowledge the Ministry of Education of Ethiopia for funding the research and Hawassa University for allowing me to conduct the study.
REFERENCES
- Thakur, M., N. Gupta, H.K. Sharma and S. Devi, 2021. Physicochemical characteristics and mineral status of honey from different agro-climatic zones of Himachal Pradesh, India. Br. Food J., 123: 3789-3804.
- Ikegbunam, N.C., J.O. Walter, E.E. Osayi, R.C. Njokuocha, M.I. Ezeadim and N.O. Nweze, 2023. Melissopalynologıcal study of Apis Mellifera L. honey sourced from different localities in the middle belt of Nigeria. Bio-Research, 21: 1845-1858.
- Haider, Z., S. Qamer, S. Kanwal, S. Manzoor and M. Naeem et al., 2022. Assessment of essential minerals and physico-chemical analysis of floral origins fresh honey produced by Apis mellifera. Braz. J. Biol., 84.
- Kumar, A., J.P.S. Gill, J.S. Bedi, M. Manav, M.J. Ansari and G.S. Walia, 2018. Sensorial and physicochemical analysis of Indian honeys for assessment of quality and floral origins. Food Res. Int., 108: 571-583.
- Ghidotti, M., Y. Fiamegos, C. Dumitrascu and M.B. de la Calle, 2021. Use of elemental profiles to verify geographical origin and botanical variety of Spanish honeys with a protected denomination of origin. Food Chem., 342.
- Bogdanov, S., 2006. Contaminants of bee products. Apidologie, 37: 1-18.
- Alemu, T., E. Seifu and A. Bezabih, 2013. Physicochemical properties of honey produced in Sekota District, Northern Ethiopia. Int. Food Res. J., 20: 3061-3067.
- Tesfa, A., K. Ejigu and A. Kebede, 2013. Assessment of current beekeeping management practice and honey bee floras of Western Amhara, Ethiopia. Int. J. Agric. Biosci., 2: 196-201.
- Gratzer, K., K. Wakjira, S. Fiedler and R. Brodschneider, 2021. Challenges and perspectives for beekeeping in Ethiopia. A review. Agron. Sustainable Dev., 41.
- Demise, S. and A. Emire, 2024. Characterization and identification of major constraints and potentials of Kiltu Sorsa Watershed, in Guji Zone, Southern Ethiopia. J. Agric. Ecol. Res. Int., 25: 114-126.
- Isengard, H.D., D. Schultheiß, B. Radović and E. Anklam, 2001. Alternatives to official analytical methods used for the water determination in honey. Food Control, 12: 459-466.
- Desfita, S., W. Sari, Yusmarini, U. Pato and G. Budryn, 2022. Characteristics of forest honey from several areas in Riau Province, Indonesia. Canrea J.: Food Technol. Nutr. Culinary J., 5: 232-242.
- Puścion-Jakubik, A., M.H. Borawska and K. Socha, 2020. Modern methods for assessing the quality of bee honey and botanical origin identification. Foods, 9.
- Altun, S.K., H. Dinç, N. Paksoy, F.K. Temamoğulları and M. Savrunlu, 2017. Analyses of mineral content and heavy metal of honey samples from South and East Region of Turkey by using ICP-MS. Int. J. Anal. Chem., 2017.
- Gashaw, W., W. Yohannes, B.S. Chandravanshi and N. Getachew, 2024. Levels of heavy metals and physicochemical properties of honey from four selected areas of Ethiopia. Bull. Chem. Soc. Ethiop., 38: 1521-1531.
- Bogdanov, S., C. Lullmann, P. Martin, W. von der Ohe and H. Russmann et al., 1999. Honey quality and international regulatory standards: Review by the international honey commission. Bee World, 80: 61-69.
- Pospiech, M., Z. Javůrková, P. Hrabec, H. Čížková and D. Titěra et al., 2021. Physico-chemical and melissopalynological characterization of Czech honey. Appl. Sci., 11.
- Homrani, M., O. Escuredo, M.S. Rodríguez-Flores, D. Fatiha, B. Mohammed, A. Homrani and M.C. Seijo, 2020. Botanical origin, pollen profile, and physicochemical properties of Algerian honey from different bioclimatic areas. Foods, 9.
- European Commission, 2002. Council Directive 2001/110/EC of 20 December 2001 relating to honey. Official J. Eur. Communit., 10: 47-52.
- Manzanares, A.B., Z.H. García, B.R. Galdón, E.M. Rodríguez-Rodríguez and C.D. Romero, 2017. Physicochemical characteristics and pollen spectrum of monofloral honeys from Tenerife, Spain. Food Chem., 228: 441-446.
- Raweh, H.S.A., A.Y. Badjah-Hadj-Ahmed, J. Iqbal and A.S. Alqarni, 2023. Physicochemical composition of local and imported honeys associated with quality standards. Foods, 12.
- El Sohaimy, S.A., S.H.D. Masry and M.G. Shehata, 2015. Physicochemical characteristics of honey from different origins. Ann. Agric. Sci., 60: 279-287.
- Equar, G., B. Abraha, H. Lemma and S. Amare, 2015. Physicochemical characterization of honey from Debre-Nazret Kebelle of Tigray Region, Ethiopia. World Appl. Sci. J., 33: 1806-1814.
- Getu, A. and M. Birhan, 2014. Chemical analysis of honey and major honey production challenges in and around Gondar, Ethiopia. Acad. J. Nutr., 3: 6-14.
- Gela, A., A. Gebresilassie, A. Atikem, T. Damto and Y. Woldehawariat, 2023. Physicochemical properties and botanical sources of honey from different areas of Ethiopia: An implication for quality control. J. Food Qual., 2023.
- Berhe, A., E. Tesfaye and D. Terle, 2018. Evaluation of physicochemical properties of honey bees (Apis mellifera) in Godere Woreda, Gambella, Ethiopia. Am. J. Food Sci. Technol., 6: 50-56.
- Belay, A., G.D. Haki, M. Birringer, H. Borck and Y.C. Lee et al., 2017. Sugar profile and physicochemical properties of Ethiopian monofloral honey. Int. J. Food Prop., 20: 2855-2866.
- Lewoyehu, M. and M. Amare, 2019. Comparative assessment on selected physicochemical parameters and antioxidant and antimicrobial activities of honey samples from selected districts of the Amhara and Tigray Regions, Ethiopia. Int. J. Food Sci., 2019.
- Damto, T., D. Kebebe and M. Gemeda, 2023. Physicochemical properties and microbial qualities of honey produced by a stingless bee (Meliponula beccarii L.) in the Oromia region, Ethiopia. Cogent Food Agric., 9.
- Cavia, M.M., M.A. Fernández-Muiño, S.R. Alonso-Torre, J.F. Huidobro and M.T. Sancho, 2007. Evolution of acidity of honeys from continental climates: Influence of induced granulation. Food Chem., 100: 1728-1733.
- Wavinya, F., M. Omolo, H. Malebo, A. Sifuna, P. Nyongesa and J. Nonoh, 2021. Antibacterial activity of honey from wild species of stingless bees; Plebenia hylderbrandii and Meliponula bocandei. J. Biosci. Med., 9: 67-84.
- de Rodrı́guez, G.O., B.S. de Ferrer, A. Ferrer and B. Rodrı́guez, 2004. Characterization of honey produced in Venezuela. Food Chem., 84: 499-502.
- Trisha, S., M.G. Mortuza, J. Rana, K. Hizbul Islam and Zannatul Ferdoush et al., 2023. Evaluation of the physicochemical qualities and antioxidant properties of some Bangladeshi varieties of honey: A comparative study. J. Agric. Food Res., 14.
- Adgaba, N., A. Al-Ghamdi, D. Sharma, Y. Tadess and S.M. Alghanem et al., 2020. Physico-chemical, antioxidant and anti-microbial properties of some Ethiopian mono-floral honeys. Saudi J. Biol. Sci., 27: 2366-2372.
- Gebeyehu, H.R. and D.D. Jalata, 2023. Physicochemical and mineral contents of honey from Fitche and Addis Ababa Districts in Ethiopia. Food Chem. Adv., 2.
- Engidaw, D., K. Alemayehu and S. Mustofa, 2019. Detection of the concentration of some metals in the honey product in Dawuro Zone, SNNPR, Ethiopia. J. Anal. Bioanal. Tech., 10.
- Lomiso, D.F., E. Dessalegn and G. Nigussie, 2019. Determination of some essential minerals in honey samples collected from Chena District, Ethiopia. Chem. Mater. Res., 11.
- Pohl, P., 2009. Determination of metal content in honey by atomic absorption and emission spectrometries. TrAC Trends Anal. Chem., 28: 117-128.
- Afroz, R., E.M. Tanvir, M.M. Hossain, 2023. Physical Properties of Honey. In: Honey: Composition and Health Benefits, Khalil, M.I., S.H. Gan and B.H. Goh (Eds.), John Wiley & Sons, New Jersey, ISBN: 9781119113324, pp: 12-31.
How to Cite this paper?
APA-7 Style
Zeleke,
D.A., Zigde,
H.M. (2026). Assessment of Physicochemical Composition and Metal Content of Honey Collected from the Guji Zone, Oromia Regional State, Ethiopia. Trends in Applied Sciences Research, 21(1), 14-23. https://doi.org/10.3923/tasr.2026.14.23
ACS Style
Zeleke,
D.A.; Zigde,
H.M. Assessment of Physicochemical Composition and Metal Content of Honey Collected from the Guji Zone, Oromia Regional State, Ethiopia. Trends Appl. Sci. Res 2026, 21, 14-23. https://doi.org/10.3923/tasr.2026.14.23
AMA Style
Zeleke
DA, Zigde
HM. Assessment of Physicochemical Composition and Metal Content of Honey Collected from the Guji Zone, Oromia Regional State, Ethiopia. Trends in Applied Sciences Research. 2026; 21(1): 14-23. https://doi.org/10.3923/tasr.2026.14.23
Chicago/Turabian Style
Zeleke, Dulecha, Alemu, and Haile Melaku Zigde.
2026. "Assessment of Physicochemical Composition and Metal Content of Honey Collected from the Guji Zone, Oromia Regional State, Ethiopia" Trends in Applied Sciences Research 21, no. 1: 14-23. https://doi.org/10.3923/tasr.2026.14.23

This work is licensed under a Creative Commons Attribution 4.0 International License.
