Effects of Some Inorganic Fertilizers on Soil Properties and Leaf Nutrient Contents of Oil Palm at NIFOR Main Station
-
Pullen Efosa Osayande


Soils and Land Management Division, Nigerian Institute for Oil Palm Research, P.M.B. 1030, Benin, Edo, Nigeria
Philip Obasogie OviasogieSoils and Land Management Division, Nigerian Institute for Oil Palm Research, P.M.B. 1030, Benin, Edo, Nigeria
| Received 29 Jul, 2023 |
Accepted 16 Dec, 2023 |
Published 02 Jan, 2024 |
Background and Objective: The uptake of chemical nutrients by oil palm for bunch production is influenced by physical properties such as bulk density, texture and moisture content of the soils and some climatic variables like rainfall, temperature and solar radiation. The objective was to examine the influence of these properties and some climatic variables on the weight and number of harvested bunches. Materials and Methods: The experiment was laid out in a Randomized Complete Block Design (RCBD) and consisted of soil sampling using AfSIS protocol and cores of known volume. Frond leaf 17 was also sampled while climatic variables were obtained from the Statistics Division of the Nigerian Institute for oil palm. Research data generated were subjected to One-way Analysis of Variance (ANOVA) using Genstat statistical software at a 5% level of probability. Results: The except for soil pH and moisture content, the applied fertilizers had no direct effects on soil chemical properties. Person’s correlation analysis showed a relationship between leaf nitrogen and solar radiation; bunch weight and number of harvested bunches as well as bunch organic matter content of the soils. Conclusion: Though the applied inorganic fertilizers had no direct effects on soil chemical properties, they however improved soil moisture content and uptake of nitrogen as revealed by leaf total N.
| Copyright © 2024 Osayande and Oviasogie. This is an open-access article distributed under the Creative Commons Attribution License, which permits unrestricted use, distribution, and reproduction in any medium, provided the original work is properly cited. |
INTRODUCTION
Oil palm as a tree crop requires a large number of nutrients for growth and productivity1,2. Consequently, fertilizer recommendations for the oil palm made on a broad scale have identified nitrogen, phosphorus, potassium and magnesium as the most important nutrient elements, i.e. N, P, K and Mg (12:12:17:2) with potassium having the highest ratio. Application of nitrogen, potassium and magnesium are the most important nutrient elements required by oil palm seedlings, while potassium and nitrogen are more important in the fruiting years3. The chemistry of release of these nutrients required by oil palm is complex such that oil palm bunch yields are frequently limited by the absence of all or some chemical constituents, soil physical properties and climatic factors4,5. It, therefore, follows that the uptake and utilization of soil nutrients by oil palm depend on a number of factors that create a situation resulting in the preference of some nutrients over others resulting in nutrient-limiting yields. Factors that limit the yield of oil palm besides the soil nutrients which are usually supplied through fertilizations are climate as defined by rainfall (volume and intensity) and temperature. Rainfall directly influences the amount of water available in the soil and influences the negative water potential making it along with monthly evapotranspiration the most important factor limiting oil palm yields6. Woittiez et al.7 have also reported that oil palm love high temperature (24-28°C) with growth inhibition at lower temperature (12-17°C) resulting in fruit abortion, poor vegetative growth and slow bunch ripening. It therefore implies that the distribution of Elaeis guineensis could also be limited by both rainfall and temperature8,9. Solar radiation influences oil palm fresh fruit bunch production by reducing the number of female inflorescences in adult palms when adjacent palms are not pruned to prevent shading. According to Adam et al.6, solar radiation contains a range of wavelengths so about half the amount of solar radiation energy reaching the leaves is used for photosynthesis. The mechanisms of these processes are largely unclear but inferences can be drawn from studying the relationships between yield parameters and soils physical and chemical properties and some climatic factors. This study was conducted therefore to determine the relationship between oil palm bunch yields, soil properties, leaf 17 and climatic variables. The objective of this current study was to determine the influence of some of these parameters, namely soil physical and chemical properties, leaf nutrient content and some climatic variables on bunch yields of oil palm at NIFOR main station.
MATERIALS AND METHODS
Description of study area: The study area is an oil palm field planted in 2016 at the main station of the Nigerian Institute for oil Palm Research (NIFOR). The soil under the palms is an Ultisols requiring frequent fertilization. Five treatments namely T1 = 1.5 kg of NPKMg 12:12:17:2, T2 = 1.0 kg of NPKMg 12:12:17:2, T3 = 1.5 kg of NPKMg 12:12:17:2+1.0 kg of MOP, T4 = 1.0 kg of NPKMg 12:12:17:2+1.5 kg of MOP and T5 = control (no fertilizers). Fertilizer application started in March, 2020 and 2021 while the soils from the various experimental plots were sampled in October, 2021.
Soils and leaf sampling: Soils from auger and cores of known volume were obtained from each experimental plot and their replicates using standard sampling procedures10. Soil samples were obtained using AfSIS protocol on soil sampling while oil palm frond 17 was identified and six leaflets were sampled from either side of the midrib as described by Rendana et al.11. The soils were accurately labelled in polyethene bags for further processing in the laboratory.
Laboratory analysis of the soils
Determination of soil physical and chemical properties and plant nutrient contents: The soils physical and chemical properties as well as plant nutrient contents were determined using standard laboratory methods. The parameters include soil pH in H2O and KCl, organic carbon, total nitrogen, available P, exchangeable cations (Ca2+, Mg2+, K+ and Na+), exchangeable acidity (Al3+, H+), soil moisture, bulk density and porosity and particle size distribution (sand, silt and clay). Similarly, total nitrogen, total phosphorus, exchangeable K, Mg, Ca and Na were determined in frond 17 of oil palm using standard laboratory methods.
Fresh fruit bunches and climatic variables measured at the main station: Records of harvested bunches (weight and number) were obtained from Harvesting Division while climatic data were obtained from the Statistics Division of the Nigerian Institute for Oil Palm Research (NIFOR).
Statistical analysis: Data generated were subjected to One-way Analysis of Variance (ANOVA) using Genstat statistical software version 12 while significant means were separated using Duncan’s Multiple Range Test at a 5% level of probability. The relationship between soil and leaf properties with bunch yields and soil and leaf properties with the climatic variables was done using SPSS IBM version 21 at 1 and 5% levels of probabilities.
RESULTS
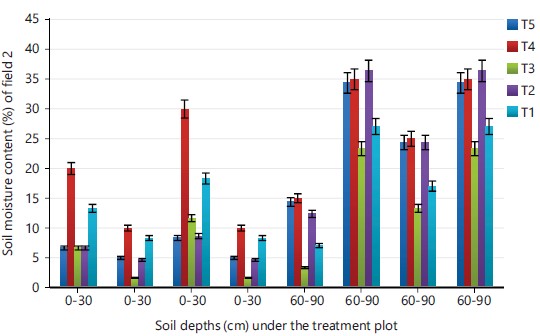
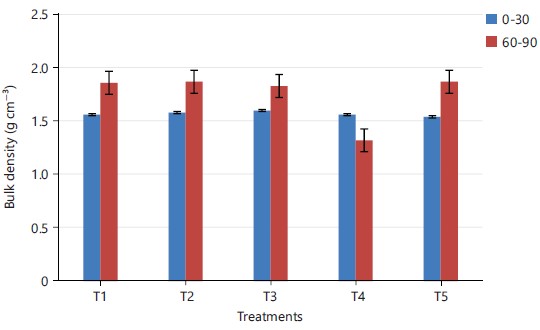
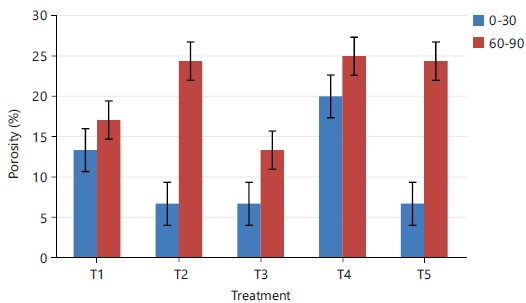
Influence of applied fertilizers on some physical properties of the soils: Moisture contents determined from each treatment plot are indicated as shown in Fig. 1 while bulk density and porosity are indicated in Fig. 2-3, respectively. Moisture content ranged from 6.67 to 20.00% in the top soils of the applied treatments and ranged from 13.33 and 25.00% in the sub soils. Mean moisture content was highest (25.00%) with the application of 1.0 kg of NPKMg 12:12:17:2+1.5 kg MOP (T4).
Bulk density ranged from 1.54 to 1.60 g cm–3 in the topsoil of the treatment plots and ranged from 1.82 to 1.87 g cm–3 in the subsoil and increased with increasing soil depths in all the treatment plots as shown in Fig. 2. Total porosity ranged from 39.62 to 41.89% in the top soil of the treated plots and ranged from 29.44 to 31.33%. The highest total porosity (41.89%) was under T5 (control) and was closely followed by 41.13% under T4 (1.0 Kg of NPKMg 12:12:17:2+1.5 MOP) as shown in Fig. 3.
Influence of applied fertilizers on chemical properties and particle size distribution of the soils: Mean soil pH in H2O and KCl were highest under treatment 5 (control) with values of 5.50 and 4.57, respectively and was the same in the other treated plots with a value of 4.94. Mean organic carbon, total nitrogen, exchangeable cations (Ca2+, Mg2+, K+ and Na+), exchangeable acidity (Al3+ and H+), ECEC, available P and particle size distribution (sand, silt and clay) were 11.40 and 1.20 g kg–1, 3.09, 0.63, 0.013, 0.14, 1.48, 0.15, 5.50 cmol kg–1, 7.40 mg kg–1, 779.3, 525.0 and 168.7 g kg–1, respectively across the five treatment plots as shown in Table 1.
|
|
|
Influence of applied fertilizers on plant nutrient content of frond 17: Mean total nitrogen of frond 17 ranged from 2.59 to 3.25%, available P ranged from 0.25 to 0.30%, exchangeable K ranged from 0.08 to 0.33%, Mg ranged from 0.03 to 0.26%, Ca ranged from 0.74 to 0.78% while Na ranged from 0.01 to 0.04% across the five treatment plots as shown in Table 2.
Yield records of the field in the year under investigation: The highest number of bunches (271) were harvested in March, 2021 weighing 904.9 kg followed by May (165) weighing 563.47 kg. The least was in January with 59 bunches weighing 202.4 kg as shown in Table 3.
Monthly climatic variables measured at NIFOR main station in 2020 and 2021: In 2020, rainfall volume was highest in September with 686.9 mm and least in January with 0.0 mm Table 4. Maximum temperature were highest in December at 32.9°C and least in September at 28.4°C, while the minimum temperature was highest in November at 25.1 and least in January at 22.5°C, respectively. Relative humidity at 0900 hrs was highest in October and least in February with 90.3 and 72.1, respectively while those taken at 1500 hrs were highest in July and least in January with 82.2 and 49.7, respectively. The highest sunshine hrs and solar radiation were in January with 5.8 and 437.1 gm/cal/cm2/day), respectively. In 2021 highest rainfall was in August and the least in December with 373.3 and 0.0, respectively Table 4. The highest maximum temperature was in January and February, at 33.5°C each and the least in August at 27.5°C. The minimum temperature was highest in February but least in June at 24.9 and 23.1°C, respectively. Relative humidity taken at 0900 hrs was highest in December and least in May at 88.6 and 80.1, respectively while those taken at 1500 hrs were highest in August and least in February at 80.6 and 45.5, respectively while the highest and least sunshine hrs were in January and August. The highest and lowest solar radiations were in June and August with 551.6 and 2.6 gm/cal/cm2/day, respectively.
Yearly climatic variables measured at NIFOR main station from 1990-2021 (30 years): Climatic variables collated for 31 years were presented in Table 5. Total annual rainfall was highest in 2020 with 2025.6 mm and least in 2016 with 1172.0 mm. The mean maximum temperature was highest at 34.3°C in 2017 and least in 1994. The highest minimum temperature were recorded in 2020 and 2021 at 23.8°C and 24.1°C, respectively as shown in Table 5. The highest mean relative humidity taken at 0900 hrs was highest in 1995 with 87.2 and least in 2007 with 77.5. The highest mean relative humidity at 1500 hrs was highest in 1996 and least in 2007, Table 5.
| Table 1: | Chemical properties and particle size distribution of soils under oil palm at NIFOR main station | |||
| Treatment | pH (H2O) |
pH (KCL) |
OC ←(g kg–1) |
TN → |
Ca ← |
Mg |
K |
Na (cmol kg–1) |
Al3+ |
H+ |
ECEC → |
P (mg kg–1) |
Sand ← |
Silt (g kg–1) |
Clay → |
| T1 | 4.94 |
4.4 |
11.4 |
1.2 |
3.09 |
0.63 |
0.013 |
0.14 |
1.48 |
0.15 |
5.5 |
7.4 |
779.3 |
525 |
168.7 |
| T2 | 4.94 |
4.4 |
11.4 |
1.2 |
3.09 |
0.63 |
0.013 |
0.14 |
1.48 |
0.15 |
5.5 |
7.4 |
779.3 |
525 |
168.7 |
| T3 | 4.94 |
4.4 |
11.4 |
1.2 |
3.09 |
0.63 |
0.013 |
0.14 |
1.48 |
0.15 |
5.5 |
7.4 |
779.3 |
525 |
168.7 |
| T4 | 4.94 |
4.4 |
11.4 |
1.2 |
3.09 |
0.63 |
0.013 |
0.14 |
1.48 |
0.15 |
5.5 |
7.4 |
779.3 |
525 |
168.7 |
| T5 | 5.5 |
4.57 |
11.4 |
1.2 |
3.09 |
0.63 |
0.013 |
0.14 |
1.48 |
0.15 |
5.5 |
7.4 |
779.3 |
525 |
168.7 |
| OC: Organic carbon, TN: Total nitrogen, Ca: Calcium, Mg: Magnesium, K: Potassium, Na: Sodium, Al3+: Aluminium, H+: Hydrogen, ECEC: Effective cation exchange capacity, P: Available phosphorus g kg–1: Gram per kilogram, cmol kg–1: Centimol per kilogram and mg kg–1: Milligram per kilogram | |||||||||||||||
| Table 2: | Plant nutrient content of frond 17 of oil palm under investigation | |||
| Treatment | N← |
P |
K (%) |
Mg |
Ca |
Na→ |
| T1 | 3.18 |
0.28 |
0.21 |
0.12 |
0.77 |
0.01 |
| T2 | 3.1 |
0.25 |
0.33 |
0.15 |
0.77 |
0.03 |
| T3 | 3.25 |
0.3 |
0.27 |
0.12 |
0.78 |
0.03 |
| T4 | 2.91 |
0.28 |
0.53 |
0.26 |
0.74 |
0.04 |
| T5 | 2.59 |
0.29 |
0.08 |
0.03 |
0.77 |
0.03 |
| N: Total nitrogen, P: Available phosphorus, K: Exchangeable potassium, Mg: Exchangeable magnesium, Ca: Exchangeable calcium and Na: Exchangeable sodium | ||||||
| Table 3: | Yield of oil palm at the field under investigation | |||
| Month | Bunch weight (kg) |
Number of bunches harvested |
| January | 202.4 |
59 |
| February | 456.71 |
113 |
| March | 904.9 |
271 |
| April | 523.3 |
145 |
| May | 563.47 |
165 |
| June | 236.4 |
65 |
| July | 333.4 |
95 |
| August | 322.5 |
75 |
| September | 425.4 |
107 |
| October | 315.5 |
70 |
| November | 320 |
74 |
| December | 359 |
99 |
| Table 4: | Mean monthly climatic variables for the year 2020 and 2021 at NIFOR main station | |||
| Month | Rainfall (mm) |
Maximum temperature (°C) |
Minimum temperature (°C) |
Relative humidity 0900 (hrs) |
Relative humidity 1500 (hrs) |
Sunshine (hrs) |
Solar radiation (gm/cal/cm2/day) |
| (2020) |
|||||||
| January | 0 |
31.9 |
22.5 |
77.3 |
49.7 |
5.8 |
437.1 |
| February | 13.3 |
32.6 |
23.2 |
72.1 |
56.4 |
3.6 |
426.1 |
| March | 197.4 |
31.5 |
23.7 |
82.4 |
70 |
4.5 |
366 |
| April | 88.6 |
32.6 |
23.7 |
78.4 |
70.9 |
5.6 |
359.4 |
| May | 212.8 |
32.3 |
24.2 |
79.9 |
69.1 |
5.7 |
393 |
| June | 292.3 |
30.2 |
23.4 |
84.3 |
73.3 |
3.6 |
273.2 |
| July | 169.8 |
28.9 |
23.7 |
88 |
82.2 |
2.3 |
284.5 |
| August | 35 |
29.1 |
23.8 |
85.1 |
74.8 |
3.4 |
331.8 |
| September | 686.9 |
28.4 |
23.2 |
87.9 |
77.7 |
1.9 |
304 |
| October | 248.1 |
29.1 |
23.8 |
90.3 |
77.6 |
2.6 |
363 |
| November | 77.1 |
31.7 |
25.1 |
82.5 |
67.1 |
3.7 |
435.4 |
| December | 4.3 |
32.9 |
25 |
84.3 |
63.7 |
3.5 |
427.5 |
| Total | 2025.6 |
371.2 |
285.3 |
992.5 |
832.5 |
462 |
4401 |
| Mean | 168.8 |
30.9 |
23.8 |
82.7 |
69.4 |
38.5 |
366.8 |
(2021) |
|||||||
| January | 10 |
33.5 |
23.4 |
84.6 |
66.8 |
7.1 |
390.6 |
| February | 8.5 |
33.5 |
24.9 |
66.8 |
45.5 |
4.9 |
378.9 |
| March | 82.6 |
32.5 |
24.7 |
77 |
63 |
4.5 |
359.1 |
| April | 161.6 |
32.5 |
24.4 |
80.8 |
69.5 |
5.9 |
479.2 |
| May | 35.2 |
31.8 |
24.3 |
80.1 |
69.9 |
5.1 |
493.6 |
| June | 391.7 |
30.8 |
23.1 |
80.2 |
76.2 |
3.7 |
551.6 |
| July | 142.5 |
28.5 |
23.5 |
85.4 |
74.1 |
3.7 |
311.5 |
| August | 373.3 |
27.5 |
24.1 |
88.1 |
80.6 |
2.6 |
281.3 |
| September | 266.6 |
29.3 |
23.7 |
85.3 |
77.2 |
4.2 |
295.4 |
| October | 100.7 |
27.6 |
24.2 |
82.2 |
73.3 |
4.5 |
370.1 |
| November | 130.3 |
31.4 |
24.3 |
82.5 |
76.2 |
6.7 |
368.5 |
| December | 0 |
32.3 |
24.4 |
88.6 |
77 |
6.4 |
405.2 |
| Total | 1703 |
3712 |
289 |
981.6 |
849.1 |
59.3 |
468.5 |
| Mean | 141.9 |
30.9 |
24.1 |
81.8 |
70.8 |
4.9 |
390.4 |
| Source: Statistics division, NIFOR | |||||||
| Table 5: | Mean yearly climatic variables for the period 1990-2021 at NIFOR main station | |||
| Year | Annual rainfall (mm) |
Mean temperature maximum (°C) |
Mean temperature minimum (°C) |
Mean relative humidity (%) 900 (hrs) |
Mean relative humidity (%) 1500 (hrs) |
Mean sunshine (hrs) |
Mean solar radiation (gm/cal/cm2/day) |
| 1990 | 2118 |
31.8 |
22.9 |
84.3 |
66.5 |
||
| 1991 | 2083.2 |
31.4 |
22.6 |
84.7 |
68.3 |
||
| 1992 | 1694.4 |
31.4 |
21.5 |
81.7 |
67.4 |
||
| 1993 | 2031.6 |
31.9 |
21.8 |
82.4 |
73.1 |
||
| 1994 | 2504.4 |
30.6 |
21.9 |
81.3 |
81.6 |
||
| 1995 | 2007.6 |
31.9 |
22.1 |
87.2 |
80.9 |
||
| 1996 | 2266.8 |
31 |
22.6 |
85.6 |
83.3 |
||
| 1997 | 1706.4 |
31.9 |
22.5 |
82.5 |
80.1 |
||
| 1998 | 1566 |
31.9 |
22.9 |
79.9 |
67.1 |
||
| 1999 | 1957.2 |
32 |
21.4 |
82.8 |
68.7 |
||
| 2000 | 1809.6 |
32 |
21.9 |
81.5 |
63.8 |
||
| 2002 | 2136 |
32.2 |
21.9 |
82.1 |
65.1 |
||
| 2003 | 1702.8 |
32.1 |
22.5 |
83.8 |
66.9 |
||
| 2004 | 1928.4 |
32 |
22.5 |
82.6 |
65.3 |
||
| 2005 | 1594.8 |
31.8 |
21.1 |
82 |
66.2 |
||
| 2006 | 1972.8 |
32.2 |
21.1 |
82 |
66.2 |
||
| 2007 | 2036.4 |
30.8 |
20.3 |
77.5 |
61.8 |
||
| 2008 | 1648.8 |
32.8 |
22.5 |
79.1 |
62.5 |
||
| 2009 | 1881.6 |
33.5 |
23.5 |
82.9 |
68.1 |
||
| 2010 | 2095.2 |
32.2 |
22.7 |
83.2 |
68.6 |
||
| 2011 | 2127.6 |
32.1 |
21 |
81.8 |
64.3 |
||
| 2012 | 1814.4 |
32 |
20.6 |
83.8 |
69.5 |
||
| 2013 | 1726.8 |
30.7 |
21.5 |
82.5 |
63.5 |
||
| 2014 | 1697.1 |
31.4 |
23.5 |
83.11 |
71.2 |
||
| 2015 | 1432.9 |
31.7 |
23.7 |
86.6 |
69.2 |
||
| 2016 | 1172 |
32.2 |
22.5 |
80.2 |
67.8 |
||
| 2017 | 1787.9 |
34.3 |
23.7 |
84.4 |
74.3 |
||
| 2018 | 1519 |
32 |
23 |
83.5 |
75.5 |
||
| 2020 | 2025.6 |
30.9 |
23.8 |
82.7 |
69.4 |
38.5 |
366.5 |
| 2021 | 1703 |
30.9 |
24.1 |
81.8 |
70 |
4.9 |
390.4 |
| Source: Statistics division, NIFOR | |||||||
| Table 6: | Correlation between climatic variables and soil properties | |||
Rainfall |
Maximum temperature |
Minimum temperature |
Relative humidity (%) 0900 (hrs) |
Relative humidity (%) 1500 (hrs) |
Sunshine (hrs) |
Solar radiation |
|
| pH (H2O) | 0.166 |
0.26 |
-0.613* |
-0.562 |
-0.235 |
0.505 |
-0.037 |
| pH (KCl) | 0.207 |
0.36 |
-0.433 |
-0.519 |
-0.303 |
0.552 |
0.182 |
| OM | -0.041 |
0.241 |
-0.443 |
-0.493 |
-0.362 |
0.29 |
0.195 |
| TN | 0.046 |
-0.256 |
-0.586* |
-0.144 |
0.009 |
0.174 |
-0.333 |
| Ca | -0.585* |
0.559 |
-0.289 |
-0.679* |
-0.621* |
0.492 |
0.429 |
| Mg | -0.657 |
0.469 |
-0.425 |
-0.647* |
-0.680* |
0.590** |
0.427 |
| K | -0.386 |
0.473 |
-0.609* |
-0.688* |
-0.737** |
0.627* |
0.442 |
| Na | -0.352 |
0.506 |
-0.594* |
-0.774** |
-0.677* |
0.542 |
0.395 |
| P | -0.18 |
-0.184 |
-0.52 |
-0.436 |
-0.503 |
0.111 |
0.166 |
| OM: Organic matter, TN: Total nitrogen, Ca: Calcium, Mg: Magnesium, K: Potassium, Na: Sodium, P: Available phosphorus, **Correlation is significant at the 0.01 level and *Correlation is significant at the 0.05 level | |||||||
Correlation between climatic variables and soil properties: There were significant correlations of Mg and K with sunshine hrs with (r = 0.590, p<0.01) and (r = 0.627 and p<0.05), respectively as shown in Table 6.
| Table 7: | Correlation between climatic variables and leaf nutrient content of frond 17 | |||
Leaf N |
Leaf P |
Leaf K |
Leaf Mg |
|
| Rainfall | -0.138 |
-0.391 |
-0.351 |
-0.477 |
| Maximum temperature | 0.537 |
0.396 |
-0.076 |
0.01 |
| Minimum temperature | -0.149 |
0.095 |
0.539 |
0.553 |
| Relative humidity-0900 hrs | -0.342 |
-0.36 |
0.346 |
0.239 |
| Relative humidity-1500 hrs | -0.496 |
-0.542 |
0.447 |
0.236 |
| Sunshine hrs | 0.17 |
0.452 |
-0.29 |
-0.231 |
| Solar radiation | 0.600* |
0.522 |
-0.233 |
-0.044 |
| TN: Total nitrogen, P: Available phosphorus, K: Potassium and Mg: Magnesium | ||||
| Table 8: | Correlation between soil properties, leaf nutrient contents of frond 17 and fresh fruit bunches of oil palm | |||
Leaf N |
Leaf P |
Leaf K |
Leaf Mg |
Leaf Ca |
Leaf Na |
Bunch weight |
No of harvested bunches |
|
| pH (H2O) | 0.172 |
-0.016 |
-0.473 |
-0.47 |
0.897 |
0.745 |
0.071 |
0.062 |
| pH (KCl) | 0.378 |
0.062 |
-0.576* |
-0.574 |
0.912 |
0.949 |
0.648* |
0.663* |
| OM | 0.23 |
-0.413 |
-0.412 |
-0.512 |
0.58 |
0.458 |
0.602* |
0.601* |
| TN | -0.428 |
-0.386 |
-0.24 |
-0.236 |
0.613 |
0.812 |
0.567 |
0.563 |
| Ca | 0.417 |
0.297 |
0.01 |
0.24 |
0.881 |
0.66 |
0.527 |
0.513 |
| Mg | 0.27 |
0.321 |
-0.102 |
-0.105 |
0.188 |
0.347 |
0.974 |
0.888 |
| K | 0.454 |
0.301 |
-0.388 |
-0.337 |
0.347 |
0.454 |
0.619 |
0.525 |
| Na | 0.441 |
0.137 |
-0.359 |
-0.316 |
0.326 |
0.978 |
0.278 |
0.238 |
| P | -0.064 |
-0.092 |
-0.35 |
-0.298 |
0.489 |
0.31 |
0.304 |
0.29 |
| Bunch weight | 0.34 |
0.137 |
0.913 |
0.738 |
0.662 |
0.317 |
- |
0.989** |
| No of harvested bunches | 0.387 |
0.171 |
0.873 |
0.694 |
0.772 |
0.512 |
0.989** |
- |
| OM: Organic matter, TN: Total nitrogen, Ca: Exchangeable calcium, Mg: Exchangeable magnesium, K: Exchangeable potassium, Na: Exchangeable sodium, P: Available phosphorus, *Correlation is significant at the 0.05 level and **Correlation is significant at the 0.01 level | ||||||||
Correlation between climatic variables and nutrient content of leaf 17: There was a positively significant (p<0.05 and r = 0.600) correlation between solar radiation and total nitrogen extracted from the leaflets of frond 17 as indicated in Table 7.
Correlation between soil properties, leaf nutrient contents frond 17 and fresh fruit bunches of oil palm: Soil pH extracted with potassium chloride was positively significantly (p<0.05) correlated with bunch weight (r = 0.648) and the number of harvested bunches (r = 0.663). Similarly, organic matter content was positively significantly (p<0.05) correlated with bunch weight (r = 0.602) and the number of harvested bunches (r = 0.601). The number of harvested bunches was positively significantly (p<0.01) correlated with the weight of bunches (r = 0.989) (Table 8).
DISCUSSION
Moisture content increased with increasing soil depths across the treated plots. Moisture content ranged from 6.67 to 20.00% in the top soils of the applied treatments and ranged from 13.33 and 25.00% in the sub soils. Mean moisture content was highest with the application of 1.0 kg of NPKMg 12:12:17:2+1.5 kg MOP (T4). This observation agreed with earlier findings by Tesfahunegn et al.12, who found that fertilizer application increases moisture contents of soils. The increase in moisture content with increased soil depth as observed in this study could be attributed to the high sandy nature of the top soils and the high content of iron and aluminium oxides encountered while siting the profile pits. This has earlier been reported by Tesfahunegn et al.12 and Efosa et al.13, who stated that the soils are generally sandy with high water percolation rates within the profiles with high content of iron and aluminium oxides in the sub soils of NIFOR main station. Moisture content was highest with lower rates of fertilizer application. This observation that reduced fertilizer rates increased soil moisture content agreed with Merten et al.14 and Osayande et al.15. The highest soil moisture values were obtained in plots that received 1.0 kg of NPKMg 12:12:17:2. Bulk density had the same trend as soil moisture of increasing with increased soil depth as earlier reported by Efosa et al.16, but the applied fertilizers did not influence the former as they did the latter. This agreed with the report of Tarigan et al.17, who showed that fertilizer application did not overly increase bulk density of soils. The trend observed with bulk density continued with the total porosity of the soils which however had an inverse relationship with the bulk density of the soils irrespective of treatments. The inverse relationship between bulk density and total porosity of soils under oil palm has been reported by Efosa et al.16 and Subramaniam et al.18. This could be attributed to the sandy nature of the soils of the oil palm belt in Nigeria12. Mean comparisons of the fertilized pots showed that the applied fertilizers only influenced soil pH (H2O) with the controlled plots having a mean soil pH (H2O) of 5.50 which is the desired soil pH for soils under oil palm5,19. The mean soil pH (H2O) of the fertilized plots was 4.94 while the pH (KCl) was 4.40. This follows that the applied fertilizers should be done with the addition of lime to reduce the effects of acidity to raise the soil pH extracted with KCl to between 5.50 and 6.0. The applied fertilizers improved leaf N, K and Mg but not P, Ca and Na. This agreed with Ande et al.20 and Bai et al.21. Simple correlation analysis between soil properties and climatic variables showed that sunshine hrs correlated positively and significantly with Mg and K while that between climatic variables and plant nutrient content showed a positive significant correlation between leaf nitrogen and solar radiation. This buttresses the need to reduce shading with the pruning of dead and adjacent fronds. According to Adam et al.6, shading reduces female inflorescences in adult palms and added that pruning the fronds of adjacent palms so as to reduce shading increases the amount of solar radiation and photosynthesis and hence increases female inflorescence production. On account of rainfall, oil palm is cultivated in the wetter areas of Southern Nigeria and some fairly wetter areas of the interior9, beyond which irrigation is required. There was a huge intra monthly variation in rainfall at the main station in both 2020 and 2021 and also huge intra annual variations in rainfall for 30 years at the main station. Maximum and minimum temperatures as well as relative humidity at 0900 hrs were more fairly constant, closely followed by solar radiation. Rainfall and temperature are important in the breakdown and mineralization of organic residues in soils. The two climatic variables must therefore be considered when establishing oil palm plantations because of the role they play in the breakdown and mineralization of organic residues in soils because of the importance of organic matter in soils. It is related to all plant nutrients, Efosa et al.16. In this study there was a positively significant correlation between organic matter and the number of harvested bunches and weights. As reported by Adam et al.6, temperature, solar radiation (intensity and duration), rainfall, atmospheric vapor pressure deficit (VPD), evaporation rate and wind speed are the main climatic elements that affect the growth and yield of oil palm. The relationship between soil pH in KCl with a number of harvested bunches and bunch weight showed the need to control cidity in the soils. There was also a relationship between the number of harvested bunches and weight which showed that a higher number of bunches will result in increased weight. The findings of this research could therefore be applied to the management of large estates of oil palm plantations through monitored pruning to allow for optimum use of sun light energy for increased photosynthesis and bunch production. The study also showed that assessment of soils for acidity and liming purposes in Ultisols under oil palm should be done using soil pH in KCl because soil pH in KCl correlated strongly and significantly with the number and weight of harvested bunches. For further research, the study opines that management of applied fertilizer to Ultisols under oil palm should be done by consideration with climatic variables such as rainfall, temperature, sunshine hrs and solar radiation.
CONCLUSION
The study concludes that though the applied inorganic fertilizers had no direct effects on soil chemical properties such as total nitrogen, available phosphorus, exchangeable cations and effective cation exchange capacity (ECEC), they however improved soil moisture content and uptake of nitrogen as revealed by leaf total N. Sunshine hrs correlated positively and significantly with potassium and magnesium while leaf N correlated positively and significantly with solar radiation. Soil pH in KCl and organic matter correlated positively and significantly with the number of harvested bunches and their corresponding weights and showed that the determination of soil pH for the assessment and maintenance of soil acidity in Ultisols under oil palm should be done by KCl extraction.
SIGNIFICANCE STATEMENT
Fertilizer application is inevitable in an oil palm cropping system if good bunch yields are to be sustained. Recent observations have however shown that nutrient deficiency symptoms still manifest on oil palms’ leaves a few months after fertilization. This is because the major nutrients required by oil palm supplied to the soil as fertilizers are influenced by soil and climatic variables. The study which sought to determine the influence of applied inorganic fertilizers on soil and leaf nutrient contents and their relationships with soil and climatic variables showed that sunshine hrs and solar radiation are important climatic variables that influence soil K and Mg as well as leaf N.
ACKNOWLEDGEMENT
The corresponding author wishes to thank the technical, laboratory and field staff of Soils and Land Management Division, NIFOR for their support and assistance through the phases of the study.
REFERENCES
- Bah, A., M.H.A. Husni, C.B.S. Teh, M.Y. Rafii, S.R.S. Omar and O.H. Ahmed, 2014. Reducing runoff loss of applied nutrients in oil palm cultivation using controlled-release fertilizers. Adv. Agric. 2014.
- Dislich, C., A.C. Keyel, J. Salecker, Y. Kisel and K.M. Meyer et al., 2017. A review of the ecosystem functions in oil palm plantations, using forests as a reference system. Biol. Rev., 92: 1539-1569.
- Purwanto, O.D. and Sudradjat, 2020. Determination of optimum rate of phosphorus and potassium fertilizers for a four-year-old oil palm (Elaeis guineensis Jacq.). IOP Conf. Ser. Earth Environ. Sci., 418.
- Behera, S.K., A.K. Shukla, K. Suresh, K. Manorama, R.K. Mathur and K. Majumdar, 2022. Yield variability in oil palm plantations in tropical India is influenced by surface and sub-surface soil fertility and leaf mineral nutrient contents. Sustainability. 14.
- Corley, R.H.V. and P.B.H. Tinker, 2016. The Oil Palm. 5th Edn., John Wiley and Sons, United States, ISBN: 9781118953297, Pages: 680.
- Adam, H., M. Collin, F. Richaud, T. Beulé and D. Cros et al., 2011. Environmental regulation of sex determination in oil palm: Current knowledge and insights from other species. Ann. Bot., 108: 1529-1537.
- Woittiez, L.S., M.T. van Wijk, M. Slingerland, M. van Noordwijk and K.E. Giller, 2017. Yield gaps in oil palm: A quantitative review of contributing factors. Eur. J. Agron., 83: 57-77.
- Abram, N.K., P. Xofis, J. Tzanopoulos, D.C. MacMillan and M. Ancrenaz et al., 2014. Synergies for improving oil palm production and forest conservation in floodplain landscapes. PLoS ONE. 9.
- Aggarwal, P.K. and N. Kalra, 1994. Analyzing the limitations set by climatic factors, genotype, and water and nitrogen availability on productivity of wheat II. Climatically potential yields and management strategies. Field Crops Res., 38: 93-103.
- Yohannes, H. and T. Soromessa, 2018. Land suitability assessment for major crops by using GIS-based multi-criteria approach in Andit Tid watershed, Ethiopia. Cogent Food Agric. 4.
- Rendana, M., S. Abdul Rahim, W.M.R. Idris, T. Lihan and Z.A. Rahman, 2016. Mapping nutrient status in oil palm plantation using geographic information system. Asian J. Agric. Res., 10: 144-153.
- Tesfahunegn, G.B., 2019. Soil moisture response to short-term inorganic fertilization on tef (Eragrostis tef (Zucc.) trotter) crop varieties in Northern Ethiopia. Appl. Environ. Soil Sci. 2019.
- Efosa, O.P., O.E. Robert and O.E. James, 2020. Relationship between some thermodynamic properties and yield parameters of oil palm in an ultisol. Ecologia, 10: 71-77.
- Merten, J., A. Röll, T. Guillaume, A. Meijide and S. Tarigan et al., 2016. Water scarcity and oil palm expansion: Social views and environmental processes. Ecol. Soc. 21.
- Osayande, P.E., P.O. Oviasogie, A.A. Edokpayi and E.R. Orhue, 2019. Identification of soil fertility indices of Inland Valley soils of NIFOR using factor analysis. Afr. J. Basic Appl. Sci., 11: 45-51.
- Efosa, O.P., U.C. Stanley, E. Stanley and O.E. Robert, 2021. Relationship between soil organic matter and some physical properties in selected soils of the oil palm belt of Nigeria. J. Nat. Sci. Res., 12: 1-7.
- Tarigan, S., S.K. Wiegand and B. Slamet, 2018. Minimum forest cover required for sustainable water flow regulation of a watershed: A case study in Jambi Province, Indonesia. Hydrol. Earth Syst. Sci., 22: 581-594.
- Subramaniam, V., Z. Hashim, S.K. Loh and A.A. Astimar, 2020. Assessing water footprint for the oil palm supply chain-a cradle to gate study. Agric. Water Manage. 237.
- Khamis, A., Z. Ismail, K. Haron and A.T. Mohammed, 2006. Modeling oil palm yield using multiple linear regression and robust M-regression. J. Agron., 5: 32-36.
- Ande, O.T., J. Huising, A.O. Ojo, J. Azeez and K.S. Are et al., 2017. Status of integrated soil fertility management (ISFM) in Southwestern Nigeria. Int. J. Sustainable Agric. Res., 4: 28-44.
- Bai, Z., H. Li, X. Yang, B. Zhou and X. Shi et al., 2013. The critical soil P levels for crop yield, soil fertility and environmental safety in different soil types. Plant Soil, 372: 27-37.
How to Cite this paper?
APA-7 Style
Osayande,
P.E., Oviasogie,
P.O. (2024). Effects of Some Inorganic Fertilizers on Soil Properties and Leaf Nutrient Contents of Oil Palm at NIFOR Main Station. Trends in Applied Sciences Research, 19(1), 28-38. https://doi.org/10.3923/tasr.2024.28.38
ACS Style
Osayande,
P.E.; Oviasogie,
P.O. Effects of Some Inorganic Fertilizers on Soil Properties and Leaf Nutrient Contents of Oil Palm at NIFOR Main Station. Trends Appl. Sci. Res 2024, 19, 28-38. https://doi.org/10.3923/tasr.2024.28.38
AMA Style
Osayande
PE, Oviasogie
PO. Effects of Some Inorganic Fertilizers on Soil Properties and Leaf Nutrient Contents of Oil Palm at NIFOR Main Station. Trends in Applied Sciences Research. 2024; 19(1): 28-38. https://doi.org/10.3923/tasr.2024.28.38
Chicago/Turabian Style
Osayande, Pullen, Efosa, and Philip Obasogie Oviasogie.
2024. "Effects of Some Inorganic Fertilizers on Soil Properties and Leaf Nutrient Contents of Oil Palm at NIFOR Main Station" Trends in Applied Sciences Research 19, no. 1: 28-38. https://doi.org/10.3923/tasr.2024.28.38

This work is licensed under a Creative Commons Attribution 4.0 International License.